Sudanese vs Choctaw Receiving Food Stamps
COMPARE
Sudanese
Choctaw
Receiving Food Stamps
Receiving Food Stamps Comparison
Sudanese
Choctaw
12.0%
RECEIVING FOOD STAMPS
33.4/ 100
METRIC RATING
188th/ 347
METRIC RANK
13.6%
RECEIVING FOOD STAMPS
1.0/ 100
METRIC RATING
241st/ 347
METRIC RANK
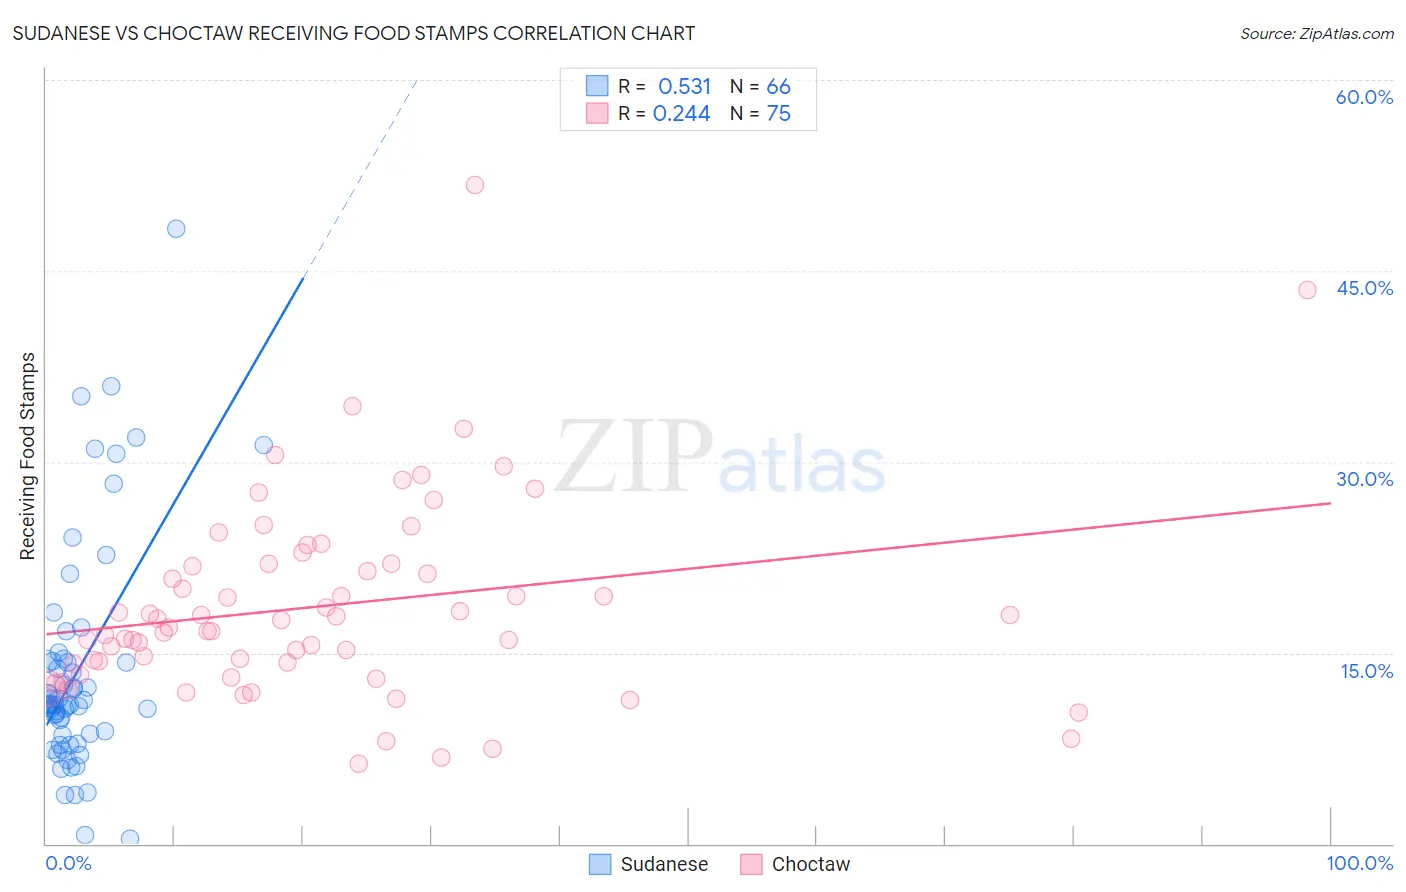
Sudanese vs Choctaw Receiving Food Stamps Correlation Chart
The statistical analysis conducted on geographies consisting of 110,066,934 people shows a substantial positive correlation between the proportion of Sudanese and percentage of population receiving government assistance and/or food stamps in the United States with a correlation coefficient (R) of 0.531 and weighted average of 12.0%. Similarly, the statistical analysis conducted on geographies consisting of 269,484,151 people shows a weak positive correlation between the proportion of Choctaw and percentage of population receiving government assistance and/or food stamps in the United States with a correlation coefficient (R) of 0.244 and weighted average of 13.6%, a difference of 13.2%.
Receiving Food Stamps Correlation Summary
| Measurement | Sudanese | Choctaw |
| Minimum | 0.40% | 6.3% |
| Maximum | 48.3% | 51.8% |
| Range | 47.9% | 45.5% |
| Mean | 13.6% | 18.7% |
| Median | 10.9% | 17.0% |
| Interquartile 25% (IQ1) | 8.6% | 14.1% |
| Interquartile 75% (IQ3) | 14.3% | 22.0% |
| Interquartile Range (IQR) | 5.8% | 7.9% |
| Standard Deviation (Sample) | 9.0% | 7.8% |
| Standard Deviation (Population) | 8.9% | 7.8% |
Similar Demographics by Receiving Food Stamps
Demographics Similar to Sudanese by Receiving Food Stamps
In terms of receiving food stamps, the demographic groups most similar to Sudanese are Immigrants from Cameroon (12.0%, a difference of 0.14%), Immigrants from Peru (12.0%, a difference of 0.20%), Venezuelan (12.0%, a difference of 0.20%), Albanian (12.0%, a difference of 0.31%), and Samoan (12.1%, a difference of 0.38%).
| Demographics | Rating | Rank | Receiving Food Stamps |
| South American Indians | 41.7 /100 | #181 | Average 11.9% |
| Immigrants | Morocco | 40.7 /100 | #182 | Average 11.9% |
| Immigrants | Uganda | 40.3 /100 | #183 | Average 11.9% |
| Spaniards | 39.8 /100 | #184 | Fair 11.9% |
| Immigrants | Iraq | 37.1 /100 | #185 | Fair 12.0% |
| Spanish | 36.9 /100 | #186 | Fair 12.0% |
| Albanians | 35.4 /100 | #187 | Fair 12.0% |
| Sudanese | 33.4 /100 | #188 | Fair 12.0% |
| Immigrants | Cameroon | 32.5 /100 | #189 | Fair 12.0% |
| Immigrants | Peru | 32.2 /100 | #190 | Fair 12.0% |
| Venezuelans | 32.1 /100 | #191 | Fair 12.0% |
| Samoans | 31.0 /100 | #192 | Fair 12.1% |
| Immigrants | Fiji | 27.8 /100 | #193 | Fair 12.1% |
| Immigrants | Sudan | 27.1 /100 | #194 | Fair 12.1% |
| Americans | 26.7 /100 | #195 | Fair 12.2% |
Demographics Similar to Choctaw by Receiving Food Stamps
In terms of receiving food stamps, the demographic groups most similar to Choctaw are Immigrants from Panama (13.6%, a difference of 0.18%), Somali (13.7%, a difference of 0.38%), Iroquois (13.5%, a difference of 0.43%), Cajun (13.7%, a difference of 0.54%), and Immigrants from Somalia (13.7%, a difference of 0.58%).
| Demographics | Rating | Rank | Receiving Food Stamps |
| Comanche | 2.4 /100 | #234 | Tragic 13.3% |
| Immigrants | Zaire | 1.9 /100 | #235 | Tragic 13.4% |
| Crow | 1.6 /100 | #236 | Tragic 13.4% |
| Immigrants | El Salvador | 1.5 /100 | #237 | Tragic 13.5% |
| French American Indians | 1.4 /100 | #238 | Tragic 13.5% |
| Immigrants | Micronesia | 1.3 /100 | #239 | Tragic 13.5% |
| Iroquois | 1.2 /100 | #240 | Tragic 13.5% |
| Choctaw | 1.0 /100 | #241 | Tragic 13.6% |
| Immigrants | Panama | 1.0 /100 | #242 | Tragic 13.6% |
| Somalis | 0.9 /100 | #243 | Tragic 13.7% |
| Cajuns | 0.9 /100 | #244 | Tragic 13.7% |
| Immigrants | Somalia | 0.9 /100 | #245 | Tragic 13.7% |
| Cree | 0.8 /100 | #246 | Tragic 13.7% |
| Mexican American Indians | 0.7 /100 | #247 | Tragic 13.8% |
| Immigrants | Laos | 0.7 /100 | #248 | Tragic 13.8% |