Sudanese vs Delaware 8th Grade
COMPARE
Sudanese
Delaware
8th Grade
8th Grade Comparison
Sudanese
Delaware
95.6%
8TH GRADE
33.0/ 100
METRIC RATING
187th/ 347
METRIC RANK
96.5%
8TH GRADE
99.2/ 100
METRIC RATING
80th/ 347
METRIC RANK
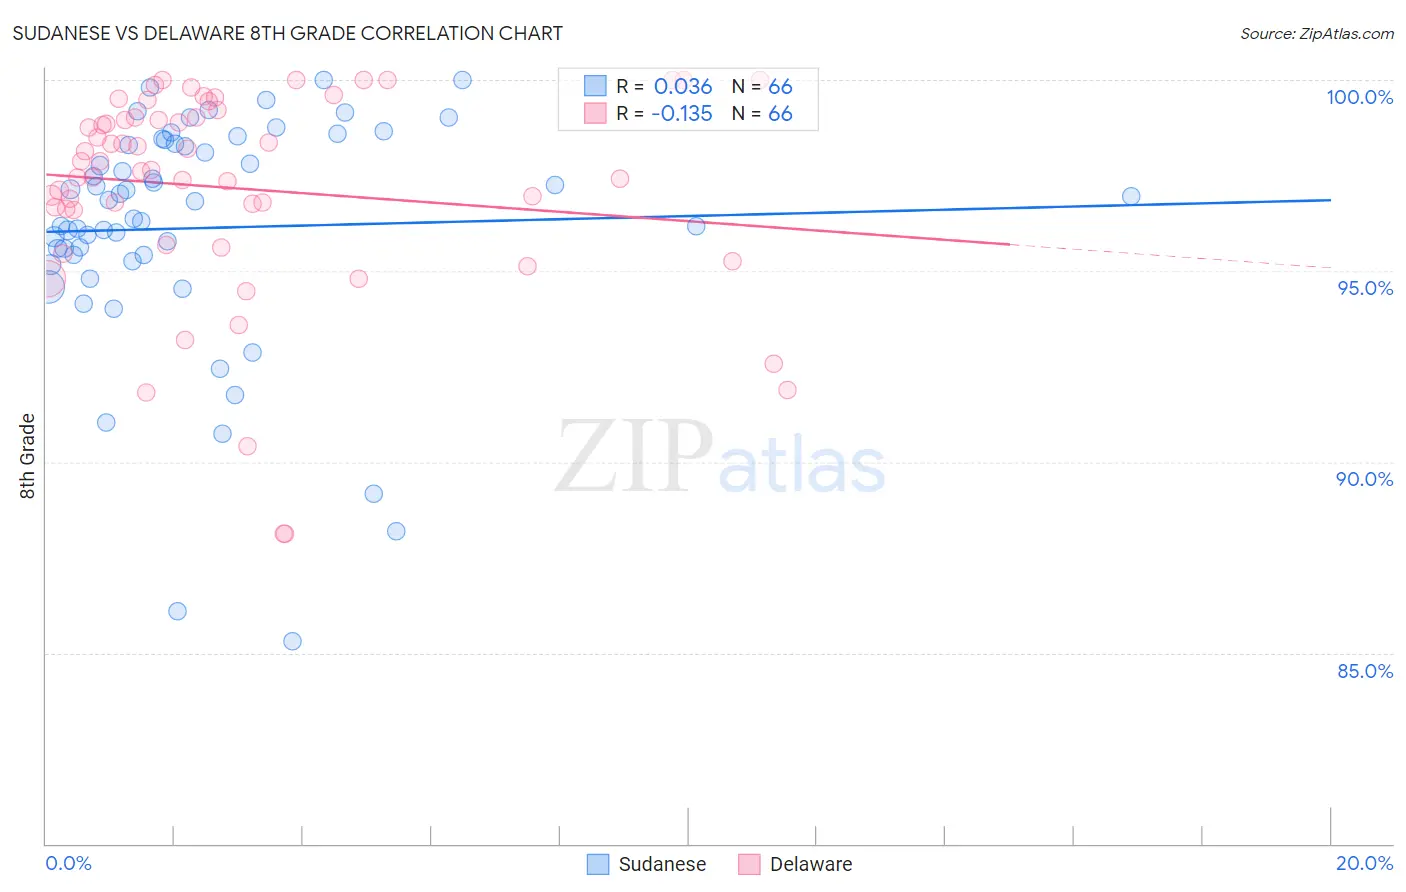
Sudanese vs Delaware 8th Grade Correlation Chart
The statistical analysis conducted on geographies consisting of 110,124,633 people shows no correlation between the proportion of Sudanese and percentage of population with at least 8th grade education in the United States with a correlation coefficient (R) of 0.036 and weighted average of 95.6%. Similarly, the statistical analysis conducted on geographies consisting of 96,234,659 people shows a poor negative correlation between the proportion of Delaware and percentage of population with at least 8th grade education in the United States with a correlation coefficient (R) of -0.135 and weighted average of 96.5%, a difference of 0.91%.
8th Grade Correlation Summary
| Measurement | Sudanese | Delaware |
| Minimum | 85.3% | 88.1% |
| Maximum | 100.0% | 100.0% |
| Range | 14.7% | 11.9% |
| Mean | 96.1% | 97.2% |
| Median | 96.8% | 97.8% |
| Interquartile 25% (IQ1) | 95.4% | 96.6% |
| Interquartile 75% (IQ3) | 98.3% | 99.0% |
| Interquartile Range (IQR) | 2.9% | 2.4% |
| Standard Deviation (Sample) | 3.1% | 2.8% |
| Standard Deviation (Population) | 3.1% | 2.7% |
Similar Demographics by 8th Grade
Demographics Similar to Sudanese by 8th Grade
In terms of 8th grade, the demographic groups most similar to Sudanese are Liberian (95.6%, a difference of 0.0%), Black/African American (95.6%, a difference of 0.010%), Brazilian (95.6%, a difference of 0.010%), Immigrants from Micronesia (95.6%, a difference of 0.010%), and Immigrants from Iraq (95.6%, a difference of 0.020%).
| Demographics | Rating | Rank | 8th Grade |
| Iraqis | 40.5 /100 | #180 | Average 95.7% |
| Immigrants | Spain | 38.7 /100 | #181 | Fair 95.7% |
| Immigrants | Egypt | 37.9 /100 | #182 | Fair 95.7% |
| Immigrants | Iraq | 36.2 /100 | #183 | Fair 95.6% |
| Immigrants | Uganda | 36.0 /100 | #184 | Fair 95.6% |
| Blacks/African Americans | 34.8 /100 | #185 | Fair 95.6% |
| Brazilians | 34.8 /100 | #186 | Fair 95.6% |
| Sudanese | 33.0 /100 | #187 | Fair 95.6% |
| Liberians | 32.4 /100 | #188 | Fair 95.6% |
| Immigrants | Micronesia | 31.6 /100 | #189 | Fair 95.6% |
| Immigrants | Venezuela | 30.8 /100 | #190 | Fair 95.6% |
| Immigrants | Nepal | 30.2 /100 | #191 | Fair 95.6% |
| Pima | 28.6 /100 | #192 | Fair 95.6% |
| Panamanians | 28.4 /100 | #193 | Fair 95.6% |
| Guamanians/Chamorros | 26.6 /100 | #194 | Fair 95.6% |
Demographics Similar to Delaware by 8th Grade
In terms of 8th grade, the demographic groups most similar to Delaware are Romanian (96.5%, a difference of 0.0%), Turkish (96.5%, a difference of 0.010%), Icelander (96.5%, a difference of 0.010%), Puget Sound Salish (96.5%, a difference of 0.020%), and Immigrants from Belgium (96.5%, a difference of 0.020%).
| Demographics | Rating | Rank | 8th Grade |
| Arapaho | 99.5 /100 | #73 | Exceptional 96.6% |
| Immigrants | Ireland | 99.5 /100 | #74 | Exceptional 96.5% |
| Zimbabweans | 99.4 /100 | #75 | Exceptional 96.5% |
| Immigrants | Netherlands | 99.4 /100 | #76 | Exceptional 96.5% |
| Cypriots | 99.4 /100 | #77 | Exceptional 96.5% |
| Yugoslavians | 99.4 /100 | #78 | Exceptional 96.5% |
| Puget Sound Salish | 99.3 /100 | #79 | Exceptional 96.5% |
| Delaware | 99.2 /100 | #80 | Exceptional 96.5% |
| Romanians | 99.2 /100 | #81 | Exceptional 96.5% |
| Turks | 99.2 /100 | #82 | Exceptional 96.5% |
| Icelanders | 99.2 /100 | #83 | Exceptional 96.5% |
| Immigrants | Belgium | 99.1 /100 | #84 | Exceptional 96.5% |
| Immigrants | South Africa | 99.1 /100 | #85 | Exceptional 96.5% |
| Cherokee | 99.0 /100 | #86 | Exceptional 96.5% |
| Immigrants | Australia | 99.0 /100 | #87 | Exceptional 96.5% |