Sudanese vs Native Hawaiian Professional Degree
COMPARE
Sudanese
Native Hawaiian
Professional Degree
Professional Degree Comparison
Sudanese
Native Hawaiians
4.6%
PROFESSIONAL DEGREE
81.3/ 100
METRIC RATING
142nd/ 347
METRIC RANK
3.8%
PROFESSIONAL DEGREE
2.3/ 100
METRIC RATING
242nd/ 347
METRIC RANK
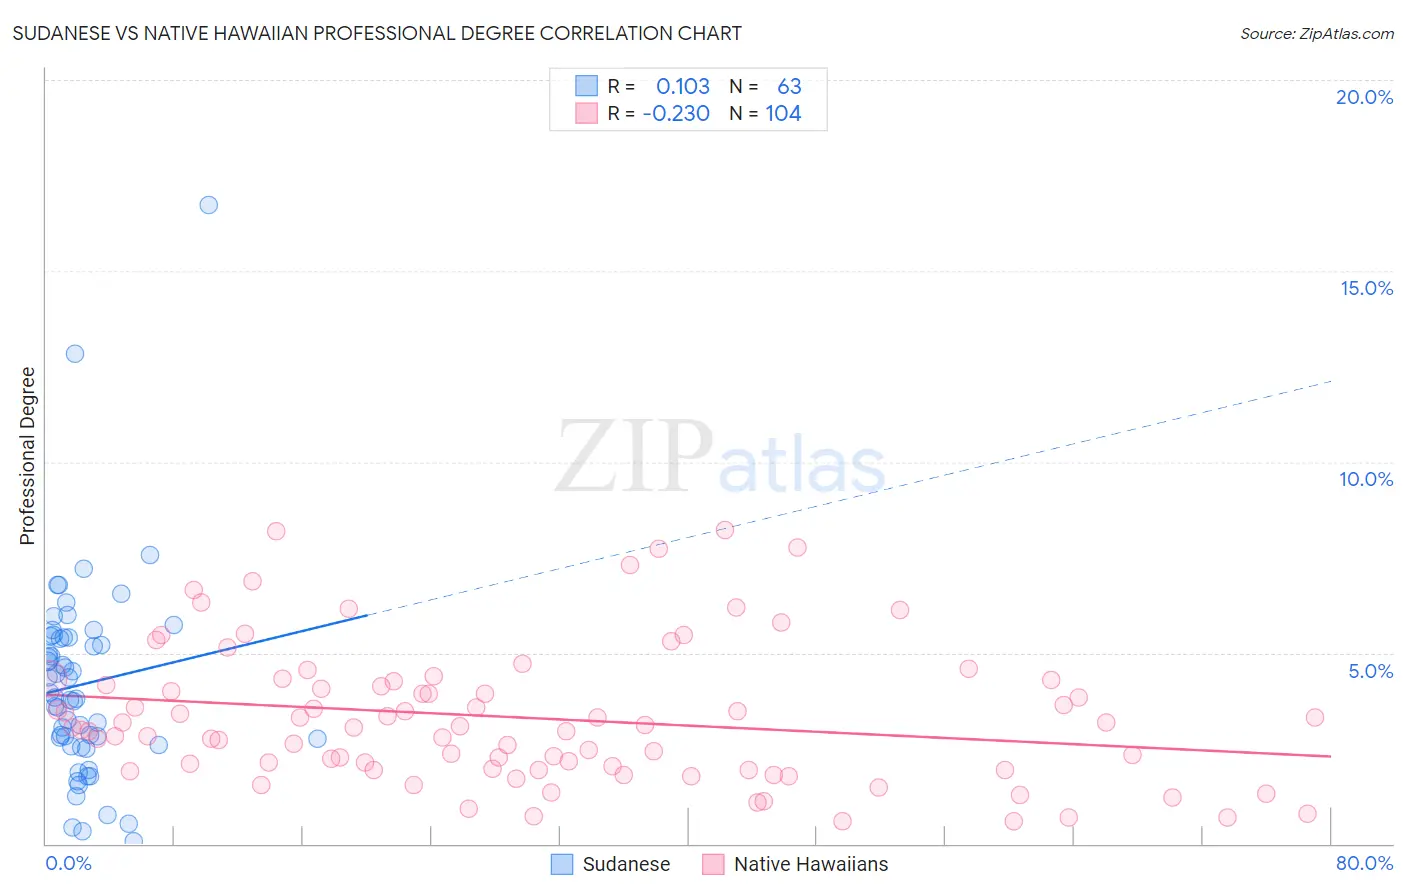
Sudanese vs Native Hawaiian Professional Degree Correlation Chart
The statistical analysis conducted on geographies consisting of 110,066,536 people shows a poor positive correlation between the proportion of Sudanese and percentage of population with at least professional degree education in the United States with a correlation coefficient (R) of 0.103 and weighted average of 4.6%. Similarly, the statistical analysis conducted on geographies consisting of 331,121,710 people shows a weak negative correlation between the proportion of Native Hawaiians and percentage of population with at least professional degree education in the United States with a correlation coefficient (R) of -0.230 and weighted average of 3.8%, a difference of 22.0%.
Professional Degree Correlation Summary
| Measurement | Sudanese | Native Hawaiian |
| Minimum | 0.061% | 0.59% |
| Maximum | 16.7% | 8.2% |
| Range | 16.7% | 7.6% |
| Mean | 4.2% | 3.3% |
| Median | 3.8% | 3.0% |
| Interquartile 25% (IQ1) | 2.6% | 2.0% |
| Interquartile 75% (IQ3) | 5.4% | 4.2% |
| Interquartile Range (IQR) | 2.8% | 2.3% |
| Standard Deviation (Sample) | 2.7% | 1.8% |
| Standard Deviation (Population) | 2.7% | 1.8% |
Similar Demographics by Professional Degree
Demographics Similar to Sudanese by Professional Degree
In terms of professional degree, the demographic groups most similar to Sudanese are Hungarian (4.6%, a difference of 0.11%), Basque (4.6%, a difference of 0.13%), Immigrants from South America (4.6%, a difference of 0.18%), Uruguayan (4.6%, a difference of 0.24%), and Luxembourger (4.6%, a difference of 0.55%).
| Demographics | Rating | Rank | Professional Degree |
| Macedonians | 89.8 /100 | #135 | Excellent 4.8% |
| Immigrants | Jordan | 89.0 /100 | #136 | Excellent 4.7% |
| Jordanians | 88.9 /100 | #137 | Excellent 4.7% |
| Afghans | 88.8 /100 | #138 | Excellent 4.7% |
| South Americans | 85.6 /100 | #139 | Excellent 4.7% |
| Canadians | 84.4 /100 | #140 | Excellent 4.7% |
| Basques | 81.8 /100 | #141 | Excellent 4.6% |
| Sudanese | 81.3 /100 | #142 | Excellent 4.6% |
| Hungarians | 80.8 /100 | #143 | Excellent 4.6% |
| Immigrants | South America | 80.5 /100 | #144 | Excellent 4.6% |
| Uruguayans | 80.2 /100 | #145 | Excellent 4.6% |
| Luxembourgers | 78.7 /100 | #146 | Good 4.6% |
| Colombians | 77.7 /100 | #147 | Good 4.6% |
| Slovenes | 76.1 /100 | #148 | Good 4.6% |
| Senegalese | 75.3 /100 | #149 | Good 4.6% |
Demographics Similar to Native Hawaiians by Professional Degree
In terms of professional degree, the demographic groups most similar to Native Hawaiians are Alaskan Athabascan (3.8%, a difference of 0.0%), Immigrants from Ecuador (3.8%, a difference of 0.020%), Guamanian/Chamorro (3.8%, a difference of 0.080%), British West Indian (3.8%, a difference of 0.25%), and Immigrants from Bahamas (3.8%, a difference of 0.51%).
| Demographics | Rating | Rank | Professional Degree |
| Immigrants | Barbados | 4.0 /100 | #235 | Tragic 3.9% |
| Spanish Americans | 3.8 /100 | #236 | Tragic 3.9% |
| Immigrants | Trinidad and Tobago | 3.8 /100 | #237 | Tragic 3.9% |
| Colville | 2.6 /100 | #238 | Tragic 3.8% |
| British West Indians | 2.4 /100 | #239 | Tragic 3.8% |
| Immigrants | Ecuador | 2.3 /100 | #240 | Tragic 3.8% |
| Alaskan Athabascans | 2.3 /100 | #241 | Tragic 3.8% |
| Native Hawaiians | 2.3 /100 | #242 | Tragic 3.8% |
| Guamanians/Chamorros | 2.2 /100 | #243 | Tragic 3.8% |
| Immigrants | Bahamas | 2.0 /100 | #244 | Tragic 3.8% |
| French American Indians | 1.7 /100 | #245 | Tragic 3.8% |
| Marshallese | 1.7 /100 | #246 | Tragic 3.8% |
| Guyanese | 1.6 /100 | #247 | Tragic 3.8% |
| Hmong | 1.6 /100 | #248 | Tragic 3.7% |
| Immigrants | Grenada | 1.5 /100 | #249 | Tragic 3.7% |