Seminole vs West Indian No Schooling Completed
COMPARE
Seminole
West Indian
No Schooling Completed
No Schooling Completed Comparison
Seminole
West Indians
1.9%
NO SCHOOLING COMPLETED
92.0/ 100
METRIC RATING
129th/ 347
METRIC RANK
2.5%
NO SCHOOLING COMPLETED
0.4/ 100
METRIC RATING
265th/ 347
METRIC RANK
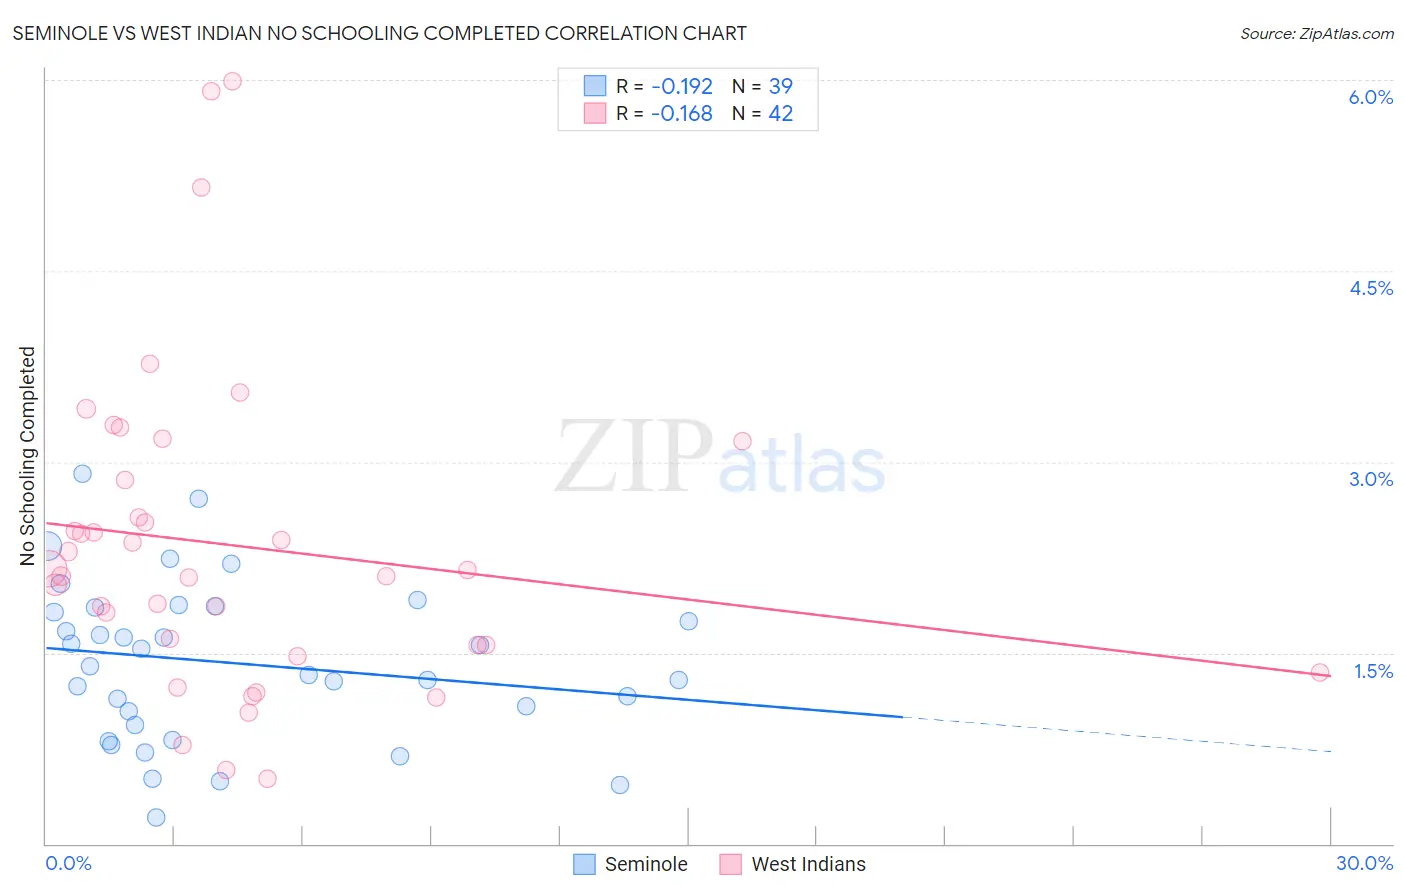
Seminole vs West Indian No Schooling Completed Correlation Chart
The statistical analysis conducted on geographies consisting of 117,813,139 people shows a poor negative correlation between the proportion of Seminole and percentage of population with no schooling in the United States with a correlation coefficient (R) of -0.192 and weighted average of 1.9%. Similarly, the statistical analysis conducted on geographies consisting of 253,089,115 people shows a poor negative correlation between the proportion of West Indians and percentage of population with no schooling in the United States with a correlation coefficient (R) of -0.168 and weighted average of 2.5%, a difference of 29.1%.
No Schooling Completed Correlation Summary
| Measurement | Seminole | West Indian |
| Minimum | 0.20% | 0.51% |
| Maximum | 2.9% | 6.0% |
| Range | 2.7% | 5.5% |
| Mean | 1.4% | 2.3% |
| Median | 1.4% | 2.1% |
| Interquartile 25% (IQ1) | 0.93% | 1.6% |
| Interquartile 75% (IQ3) | 1.9% | 2.9% |
| Interquartile Range (IQR) | 0.92% | 1.3% |
| Standard Deviation (Sample) | 0.62% | 1.2% |
| Standard Deviation (Population) | 0.62% | 1.2% |
Similar Demographics by No Schooling Completed
Demographics Similar to Seminole by No Schooling Completed
In terms of no schooling completed, the demographic groups most similar to Seminole are Palestinian (1.9%, a difference of 0.11%), Spaniard (1.9%, a difference of 0.14%), Immigrants from Hungary (1.9%, a difference of 0.21%), Israeli (1.9%, a difference of 0.23%), and Immigrants from Romania (1.9%, a difference of 0.29%).
| Demographics | Rating | Rank | No Schooling Completed |
| Cree | 94.5 /100 | #122 | Exceptional 1.9% |
| Immigrants | Kuwait | 93.9 /100 | #123 | Exceptional 1.9% |
| Cambodians | 93.8 /100 | #124 | Exceptional 1.9% |
| Immigrants | Europe | 93.7 /100 | #125 | Exceptional 1.9% |
| Immigrants | Romania | 92.6 /100 | #126 | Exceptional 1.9% |
| Israelis | 92.4 /100 | #127 | Exceptional 1.9% |
| Spaniards | 92.3 /100 | #128 | Exceptional 1.9% |
| Seminole | 92.0 /100 | #129 | Exceptional 1.9% |
| Palestinians | 91.8 /100 | #130 | Exceptional 1.9% |
| Immigrants | Hungary | 91.6 /100 | #131 | Exceptional 1.9% |
| Colville | 90.4 /100 | #132 | Exceptional 1.9% |
| Immigrants | Turkey | 90.2 /100 | #133 | Exceptional 1.9% |
| Menominee | 89.6 /100 | #134 | Excellent 1.9% |
| Hmong | 88.5 /100 | #135 | Excellent 1.9% |
| Burmese | 88.2 /100 | #136 | Excellent 1.9% |
Demographics Similar to West Indians by No Schooling Completed
In terms of no schooling completed, the demographic groups most similar to West Indians are Fijian (2.5%, a difference of 0.080%), Indian (Asian) (2.5%, a difference of 0.18%), Yuman (2.5%, a difference of 0.25%), Immigrants from Liberia (2.5%, a difference of 0.31%), and Immigrants from Sierra Leone (2.5%, a difference of 0.48%).
| Demographics | Rating | Rank | No Schooling Completed |
| Assyrians/Chaldeans/Syriacs | 0.6 /100 | #258 | Tragic 2.5% |
| Immigrants | Jamaica | 0.6 /100 | #259 | Tragic 2.5% |
| Immigrants | Ethiopia | 0.6 /100 | #260 | Tragic 2.5% |
| Armenians | 0.5 /100 | #261 | Tragic 2.5% |
| Immigrants | Sierra Leone | 0.5 /100 | #262 | Tragic 2.5% |
| Immigrants | Liberia | 0.4 /100 | #263 | Tragic 2.5% |
| Indians (Asian) | 0.4 /100 | #264 | Tragic 2.5% |
| West Indians | 0.4 /100 | #265 | Tragic 2.5% |
| Fijians | 0.4 /100 | #266 | Tragic 2.5% |
| Yuman | 0.4 /100 | #267 | Tragic 2.5% |
| Taiwanese | 0.3 /100 | #268 | Tragic 2.5% |
| Immigrants | Nigeria | 0.2 /100 | #269 | Tragic 2.5% |
| Immigrants | Peru | 0.2 /100 | #270 | Tragic 2.5% |
| Cubans | 0.2 /100 | #271 | Tragic 2.5% |
| Immigrants | Bolivia | 0.2 /100 | #272 | Tragic 2.5% |