Subsaharan African vs Immigrants from Australia Nursery School
COMPARE
Subsaharan African
Immigrants from Australia
Nursery School
Nursery School Comparison
Sub-Saharan Africans
Immigrants from Australia
97.7%
NURSERY SCHOOL
3.2/ 100
METRIC RATING
227th/ 347
METRIC RANK
98.3%
NURSERY SCHOOL
99.0/ 100
METRIC RATING
86th/ 347
METRIC RANK
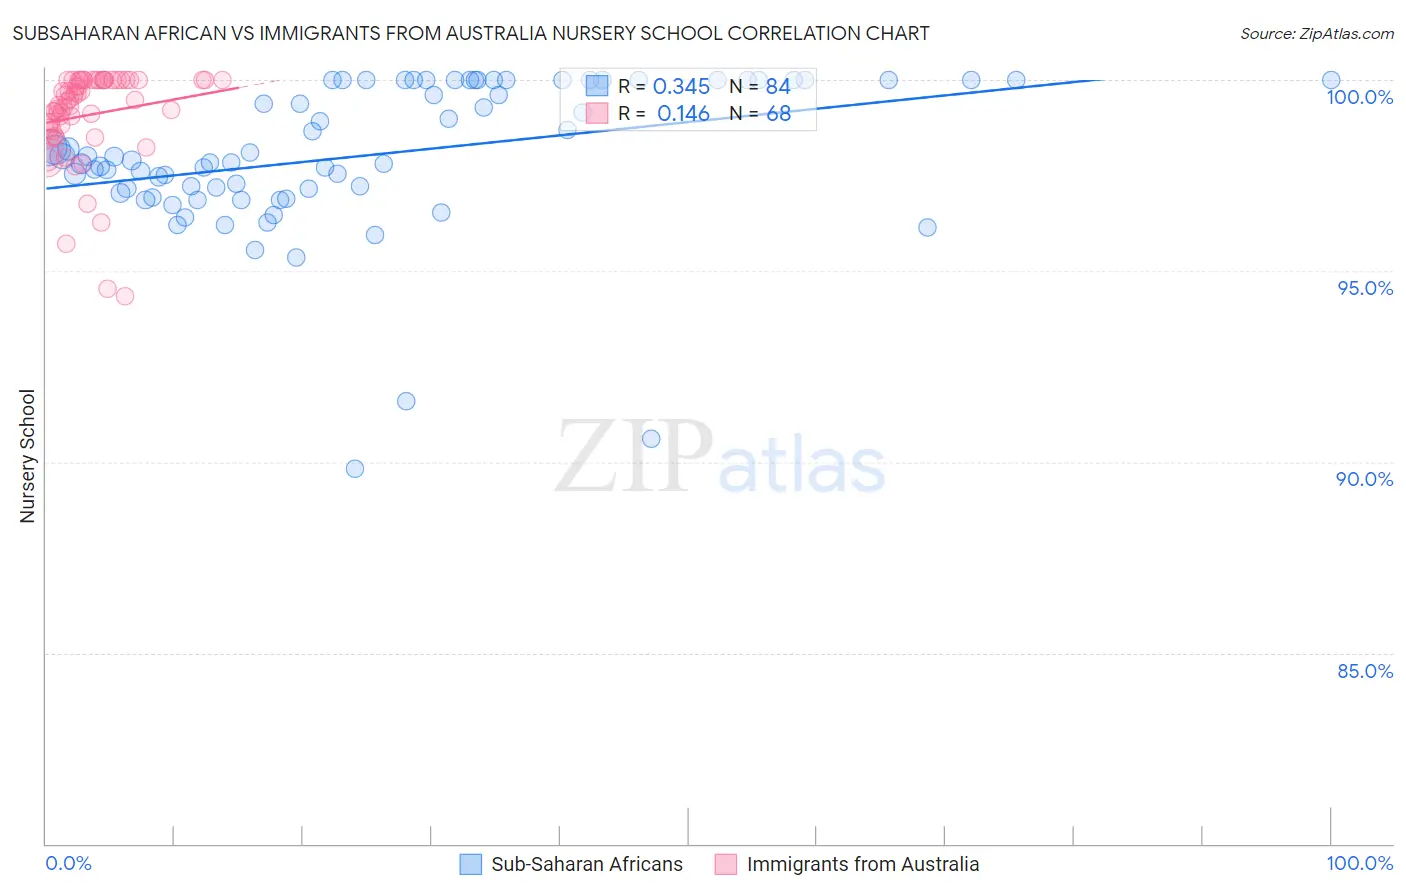
Subsaharan African vs Immigrants from Australia Nursery School Correlation Chart
The statistical analysis conducted on geographies consisting of 508,209,936 people shows a mild positive correlation between the proportion of Sub-Saharan Africans and percentage of population with at least nursery school education in the United States with a correlation coefficient (R) of 0.345 and weighted average of 97.7%. Similarly, the statistical analysis conducted on geographies consisting of 227,203,469 people shows a poor positive correlation between the proportion of Immigrants from Australia and percentage of population with at least nursery school education in the United States with a correlation coefficient (R) of 0.146 and weighted average of 98.3%, a difference of 0.60%.
Nursery School Correlation Summary
| Measurement | Subsaharan African | Immigrants from Australia |
| Minimum | 89.8% | 94.3% |
| Maximum | 100.0% | 100.0% |
| Range | 10.2% | 5.7% |
| Mean | 98.0% | 99.1% |
| Median | 97.9% | 99.5% |
| Interquartile 25% (IQ1) | 97.1% | 98.7% |
| Interquartile 75% (IQ3) | 100.0% | 100.0% |
| Interquartile Range (IQR) | 2.9% | 1.3% |
| Standard Deviation (Sample) | 2.0% | 1.2% |
| Standard Deviation (Population) | 2.0% | 1.2% |
Similar Demographics by Nursery School
Demographics Similar to Sub-Saharan Africans by Nursery School
In terms of nursery school, the demographic groups most similar to Sub-Saharan Africans are Sudanese (97.7%, a difference of 0.0%), Senegalese (97.7%, a difference of 0.0%), Immigrants from Nepal (97.7%, a difference of 0.010%), Immigrants from Costa Rica (97.7%, a difference of 0.010%), and Iraqi (97.7%, a difference of 0.010%).
| Demographics | Rating | Rank | Nursery School |
| Immigrants | Zaire | 4.4 /100 | #220 | Tragic 97.8% |
| Tongans | 4.3 /100 | #221 | Tragic 97.8% |
| Immigrants | Syria | 4.0 /100 | #222 | Tragic 97.7% |
| Immigrants | Sudan | 3.9 /100 | #223 | Tragic 97.7% |
| Immigrants | Nepal | 3.6 /100 | #224 | Tragic 97.7% |
| Immigrants | Costa Rica | 3.5 /100 | #225 | Tragic 97.7% |
| Iraqis | 3.5 /100 | #226 | Tragic 97.7% |
| Sub-Saharan Africans | 3.2 /100 | #227 | Tragic 97.7% |
| Sudanese | 3.2 /100 | #228 | Tragic 97.7% |
| Senegalese | 3.2 /100 | #229 | Tragic 97.7% |
| Sierra Leoneans | 2.9 /100 | #230 | Tragic 97.7% |
| Puerto Ricans | 2.6 /100 | #231 | Tragic 97.7% |
| Immigrants | Uruguay | 2.3 /100 | #232 | Tragic 97.7% |
| U.S. Virgin Islanders | 2.1 /100 | #233 | Tragic 97.7% |
| Colombians | 2.1 /100 | #234 | Tragic 97.7% |
Demographics Similar to Immigrants from Australia by Nursery School
In terms of nursery school, the demographic groups most similar to Immigrants from Australia are Osage (98.3%, a difference of 0.010%), Immigrants from Denmark (98.3%, a difference of 0.010%), Immigrants from Sweden (98.3%, a difference of 0.010%), Hopi (98.3%, a difference of 0.010%), and Ukrainian (98.3%, a difference of 0.010%).
| Demographics | Rating | Rank | Nursery School |
| Immigrants | Belgium | 99.3 /100 | #79 | Exceptional 98.3% |
| Shoshone | 99.3 /100 | #80 | Exceptional 98.3% |
| Icelanders | 99.2 /100 | #81 | Exceptional 98.3% |
| Potawatomi | 99.2 /100 | #82 | Exceptional 98.3% |
| Osage | 99.1 /100 | #83 | Exceptional 98.3% |
| Immigrants | Denmark | 99.1 /100 | #84 | Exceptional 98.3% |
| Immigrants | Sweden | 99.1 /100 | #85 | Exceptional 98.3% |
| Immigrants | Australia | 99.0 /100 | #86 | Exceptional 98.3% |
| Hopi | 98.9 /100 | #87 | Exceptional 98.3% |
| Ukrainians | 98.9 /100 | #88 | Exceptional 98.3% |
| Immigrants | South Africa | 98.8 /100 | #89 | Exceptional 98.3% |
| Immigrants | Western Europe | 98.8 /100 | #90 | Exceptional 98.3% |
| Zimbabweans | 98.8 /100 | #91 | Exceptional 98.3% |
| Macedonians | 98.7 /100 | #92 | Exceptional 98.3% |
| Immigrants | India | 98.7 /100 | #93 | Exceptional 98.3% |