Subsaharan African vs Immigrants from Belize Nursery School
COMPARE
Subsaharan African
Immigrants from Belize
Nursery School
Nursery School Comparison
Sub-Saharan Africans
Immigrants from Belize
97.7%
NURSERY SCHOOL
3.2/ 100
METRIC RATING
227th/ 347
METRIC RANK
96.9%
NURSERY SCHOOL
0.0/ 100
METRIC RATING
316th/ 347
METRIC RANK
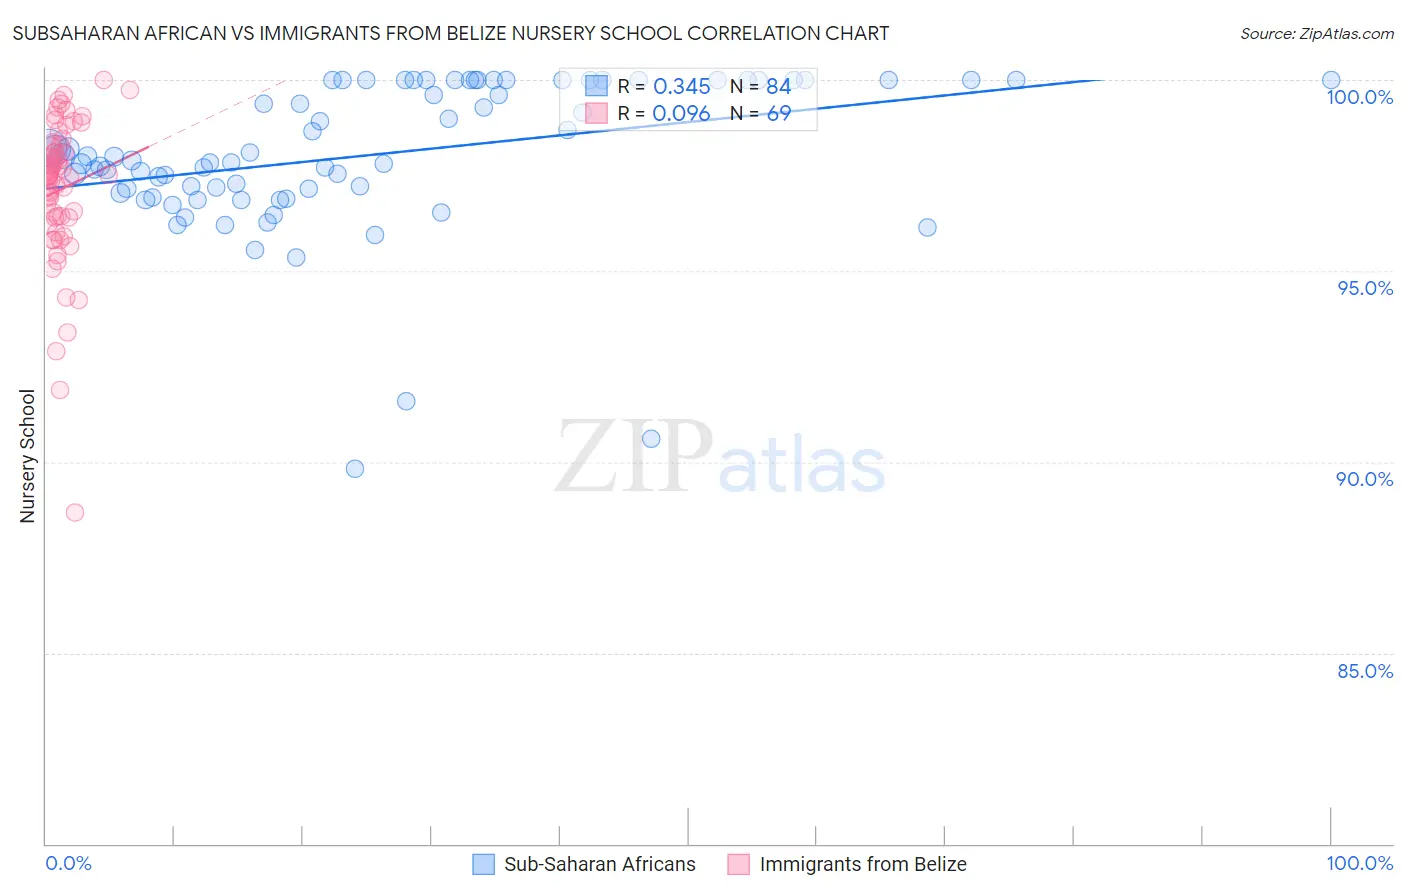
Subsaharan African vs Immigrants from Belize Nursery School Correlation Chart
The statistical analysis conducted on geographies consisting of 508,209,936 people shows a mild positive correlation between the proportion of Sub-Saharan Africans and percentage of population with at least nursery school education in the United States with a correlation coefficient (R) of 0.345 and weighted average of 97.7%. Similarly, the statistical analysis conducted on geographies consisting of 130,328,311 people shows a slight positive correlation between the proportion of Immigrants from Belize and percentage of population with at least nursery school education in the United States with a correlation coefficient (R) of 0.096 and weighted average of 96.9%, a difference of 0.81%.
Nursery School Correlation Summary
| Measurement | Subsaharan African | Immigrants from Belize |
| Minimum | 89.8% | 88.7% |
| Maximum | 100.0% | 100.0% |
| Range | 10.2% | 11.3% |
| Mean | 98.0% | 97.1% |
| Median | 97.9% | 97.5% |
| Interquartile 25% (IQ1) | 97.1% | 96.4% |
| Interquartile 75% (IQ3) | 100.0% | 98.3% |
| Interquartile Range (IQR) | 2.9% | 1.9% |
| Standard Deviation (Sample) | 2.0% | 1.9% |
| Standard Deviation (Population) | 2.0% | 1.9% |
Similar Demographics by Nursery School
Demographics Similar to Sub-Saharan Africans by Nursery School
In terms of nursery school, the demographic groups most similar to Sub-Saharan Africans are Sudanese (97.7%, a difference of 0.0%), Senegalese (97.7%, a difference of 0.0%), Immigrants from Nepal (97.7%, a difference of 0.010%), Immigrants from Costa Rica (97.7%, a difference of 0.010%), and Iraqi (97.7%, a difference of 0.010%).
| Demographics | Rating | Rank | Nursery School |
| Immigrants | Zaire | 4.4 /100 | #220 | Tragic 97.8% |
| Tongans | 4.3 /100 | #221 | Tragic 97.8% |
| Immigrants | Syria | 4.0 /100 | #222 | Tragic 97.7% |
| Immigrants | Sudan | 3.9 /100 | #223 | Tragic 97.7% |
| Immigrants | Nepal | 3.6 /100 | #224 | Tragic 97.7% |
| Immigrants | Costa Rica | 3.5 /100 | #225 | Tragic 97.7% |
| Iraqis | 3.5 /100 | #226 | Tragic 97.7% |
| Sub-Saharan Africans | 3.2 /100 | #227 | Tragic 97.7% |
| Sudanese | 3.2 /100 | #228 | Tragic 97.7% |
| Senegalese | 3.2 /100 | #229 | Tragic 97.7% |
| Sierra Leoneans | 2.9 /100 | #230 | Tragic 97.7% |
| Puerto Ricans | 2.6 /100 | #231 | Tragic 97.7% |
| Immigrants | Uruguay | 2.3 /100 | #232 | Tragic 97.7% |
| U.S. Virgin Islanders | 2.1 /100 | #233 | Tragic 97.7% |
| Colombians | 2.1 /100 | #234 | Tragic 97.7% |
Demographics Similar to Immigrants from Belize by Nursery School
In terms of nursery school, the demographic groups most similar to Immigrants from Belize are Cape Verdean (97.0%, a difference of 0.0%), Immigrants from Nicaragua (96.9%, a difference of 0.0%), Honduran (97.0%, a difference of 0.010%), Immigrants from Ecuador (96.9%, a difference of 0.010%), and Guyanese (97.0%, a difference of 0.040%).
| Demographics | Rating | Rank | Nursery School |
| Immigrants | Somalia | 0.0 /100 | #309 | Tragic 97.0% |
| Guyanese | 0.0 /100 | #310 | Tragic 97.0% |
| Immigrants | Azores | 0.0 /100 | #311 | Tragic 97.0% |
| Sri Lankans | 0.0 /100 | #312 | Tragic 97.0% |
| Hondurans | 0.0 /100 | #313 | Tragic 97.0% |
| Cape Verdeans | 0.0 /100 | #314 | Tragic 97.0% |
| Immigrants | Nicaragua | 0.0 /100 | #315 | Tragic 96.9% |
| Immigrants | Belize | 0.0 /100 | #316 | Tragic 96.9% |
| Immigrants | Ecuador | 0.0 /100 | #317 | Tragic 96.9% |
| Immigrants | Guyana | 0.0 /100 | #318 | Tragic 96.9% |
| Immigrants | Laos | 0.0 /100 | #319 | Tragic 96.9% |
| Immigrants | Burma/Myanmar | 0.0 /100 | #320 | Tragic 96.9% |
| Immigrants | Bangladesh | 0.0 /100 | #321 | Tragic 96.9% |
| Mexican American Indians | 0.0 /100 | #322 | Tragic 96.9% |
| Immigrants | Honduras | 0.0 /100 | #323 | Tragic 96.9% |