Sri Lankan vs Immigrants from Trinidad and Tobago Disability Age 35 to 64
COMPARE
Sri Lankan
Immigrants from Trinidad and Tobago
Disability Age 35 to 64
Disability Age 35 to 64 Comparison
Sri Lankans
Immigrants from Trinidad and Tobago
10.2%
DISABILITY AGE 35 TO 64
99.2/ 100
METRIC RATING
84th/ 347
METRIC RANK
11.2%
DISABILITY AGE 35 TO 64
55.9/ 100
METRIC RATING
171st/ 347
METRIC RANK
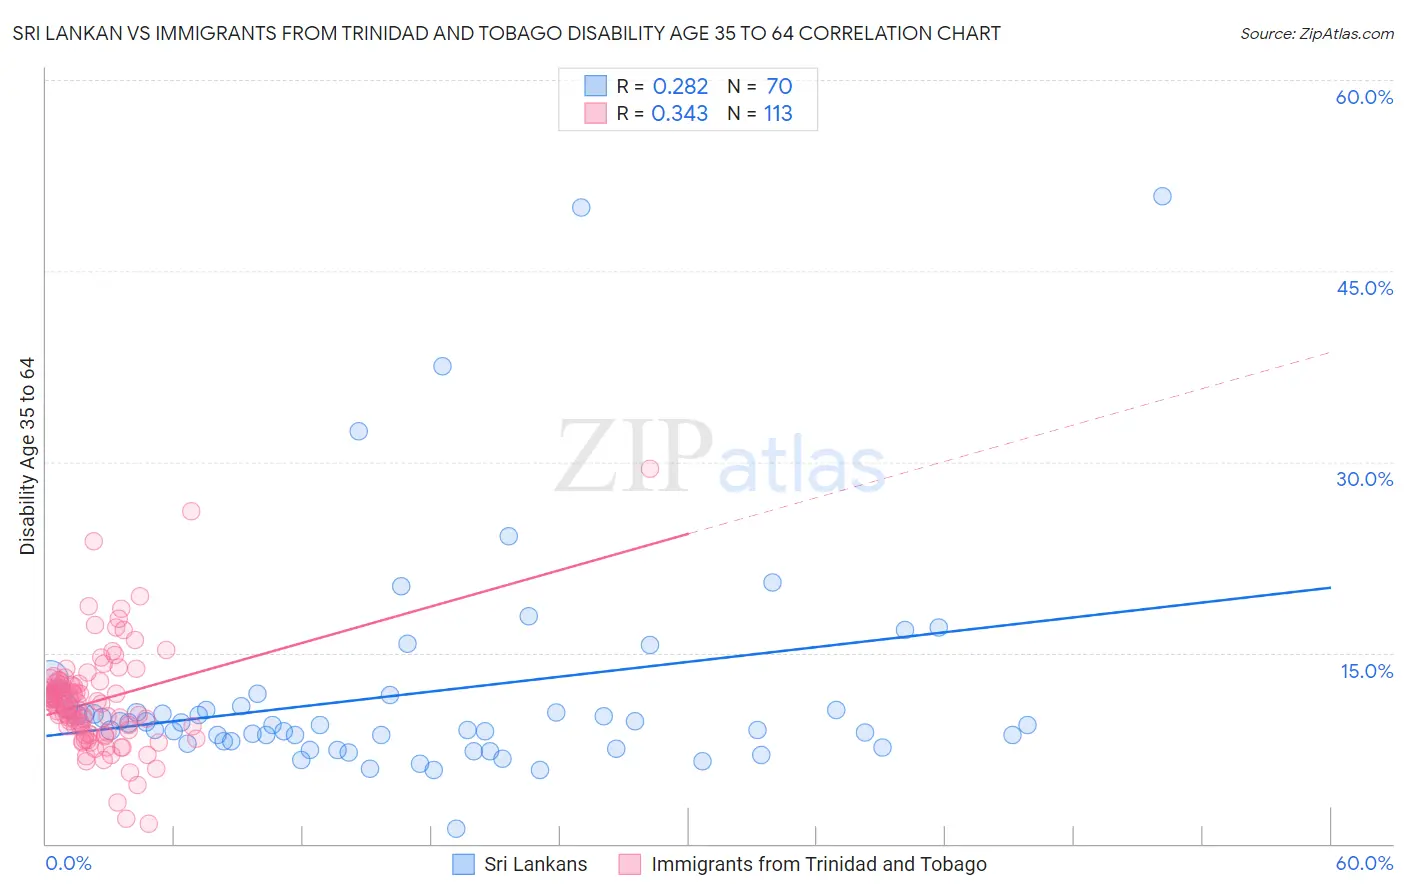
Sri Lankan vs Immigrants from Trinidad and Tobago Disability Age 35 to 64 Correlation Chart
The statistical analysis conducted on geographies consisting of 440,040,634 people shows a weak positive correlation between the proportion of Sri Lankans and percentage of population with a disability between the ages 34 and 64 in the United States with a correlation coefficient (R) of 0.282 and weighted average of 10.2%. Similarly, the statistical analysis conducted on geographies consisting of 223,452,202 people shows a mild positive correlation between the proportion of Immigrants from Trinidad and Tobago and percentage of population with a disability between the ages 34 and 64 in the United States with a correlation coefficient (R) of 0.343 and weighted average of 11.2%, a difference of 10.1%.
Disability Age 35 to 64 Correlation Summary
| Measurement | Sri Lankan | Immigrants from Trinidad and Tobago |
| Minimum | 1.2% | 1.6% |
| Maximum | 50.9% | 29.4% |
| Range | 49.7% | 27.9% |
| Mean | 11.8% | 11.2% |
| Median | 9.3% | 11.0% |
| Interquartile 25% (IQ1) | 8.0% | 8.8% |
| Interquartile 75% (IQ3) | 10.8% | 12.5% |
| Interquartile Range (IQR) | 2.7% | 3.7% |
| Standard Deviation (Sample) | 8.7% | 4.1% |
| Standard Deviation (Population) | 8.7% | 4.0% |
Similar Demographics by Disability Age 35 to 64
Demographics Similar to Sri Lankans by Disability Age 35 to 64
In terms of disability age 35 to 64, the demographic groups most similar to Sri Lankans are Immigrants from Brazil (10.2%, a difference of 0.060%), Russian (10.2%, a difference of 0.080%), Latvian (10.2%, a difference of 0.13%), Immigrants from Kuwait (10.2%, a difference of 0.21%), and Immigrants from Croatia (10.2%, a difference of 0.23%).
| Demographics | Rating | Rank | Disability Age 35 to 64 |
| Mongolians | 99.4 /100 | #77 | Exceptional 10.1% |
| Jordanians | 99.3 /100 | #78 | Exceptional 10.1% |
| Immigrants | Vietnam | 99.3 /100 | #79 | Exceptional 10.1% |
| Immigrants | Croatia | 99.3 /100 | #80 | Exceptional 10.2% |
| Latvians | 99.2 /100 | #81 | Exceptional 10.2% |
| Russians | 99.2 /100 | #82 | Exceptional 10.2% |
| Immigrants | Brazil | 99.2 /100 | #83 | Exceptional 10.2% |
| Sri Lankans | 99.2 /100 | #84 | Exceptional 10.2% |
| Immigrants | Kuwait | 99.1 /100 | #85 | Exceptional 10.2% |
| Immigrants | Europe | 99.1 /100 | #86 | Exceptional 10.2% |
| Nicaraguans | 99.1 /100 | #87 | Exceptional 10.2% |
| Chileans | 99.0 /100 | #88 | Exceptional 10.2% |
| Uruguayans | 99.0 /100 | #89 | Exceptional 10.2% |
| Afghans | 98.9 /100 | #90 | Exceptional 10.3% |
| Immigrants | Lebanon | 98.9 /100 | #91 | Exceptional 10.3% |
Demographics Similar to Immigrants from Trinidad and Tobago by Disability Age 35 to 64
In terms of disability age 35 to 64, the demographic groups most similar to Immigrants from Trinidad and Tobago are Italian (11.2%, a difference of 0.020%), Immigrants from Uganda (11.2%, a difference of 0.17%), Haitian (11.2%, a difference of 0.25%), Central American (11.2%, a difference of 0.26%), and Lebanese (11.3%, a difference of 0.34%).
| Demographics | Rating | Rank | Disability Age 35 to 64 |
| Pakistanis | 65.8 /100 | #164 | Good 11.1% |
| Immigrants | Western Europe | 65.2 /100 | #165 | Good 11.1% |
| Immigrants | Haiti | 63.8 /100 | #166 | Good 11.1% |
| Austrians | 63.2 /100 | #167 | Good 11.1% |
| Central Americans | 59.1 /100 | #168 | Average 11.2% |
| Haitians | 59.0 /100 | #169 | Average 11.2% |
| Immigrants | Uganda | 58.0 /100 | #170 | Average 11.2% |
| Immigrants | Trinidad and Tobago | 55.9 /100 | #171 | Average 11.2% |
| Italians | 55.6 /100 | #172 | Average 11.2% |
| Lebanese | 51.8 /100 | #173 | Average 11.3% |
| Immigrants | Fiji | 50.0 /100 | #174 | Average 11.3% |
| Czechs | 47.9 /100 | #175 | Average 11.3% |
| Ugandans | 43.7 /100 | #176 | Average 11.3% |
| Immigrants | Eastern Africa | 42.2 /100 | #177 | Average 11.3% |
| Poles | 42.0 /100 | #178 | Average 11.3% |