Immigrants from Uzbekistan vs Arab Nursery School
COMPARE
Immigrants from Uzbekistan
Arab
Nursery School
Nursery School Comparison
Immigrants from Uzbekistan
Arabs
97.4%
NURSERY SCHOOL
0.1/ 100
METRIC RATING
278th/ 347
METRIC RANK
97.9%
NURSERY SCHOOL
34.7/ 100
METRIC RATING
188th/ 347
METRIC RANK
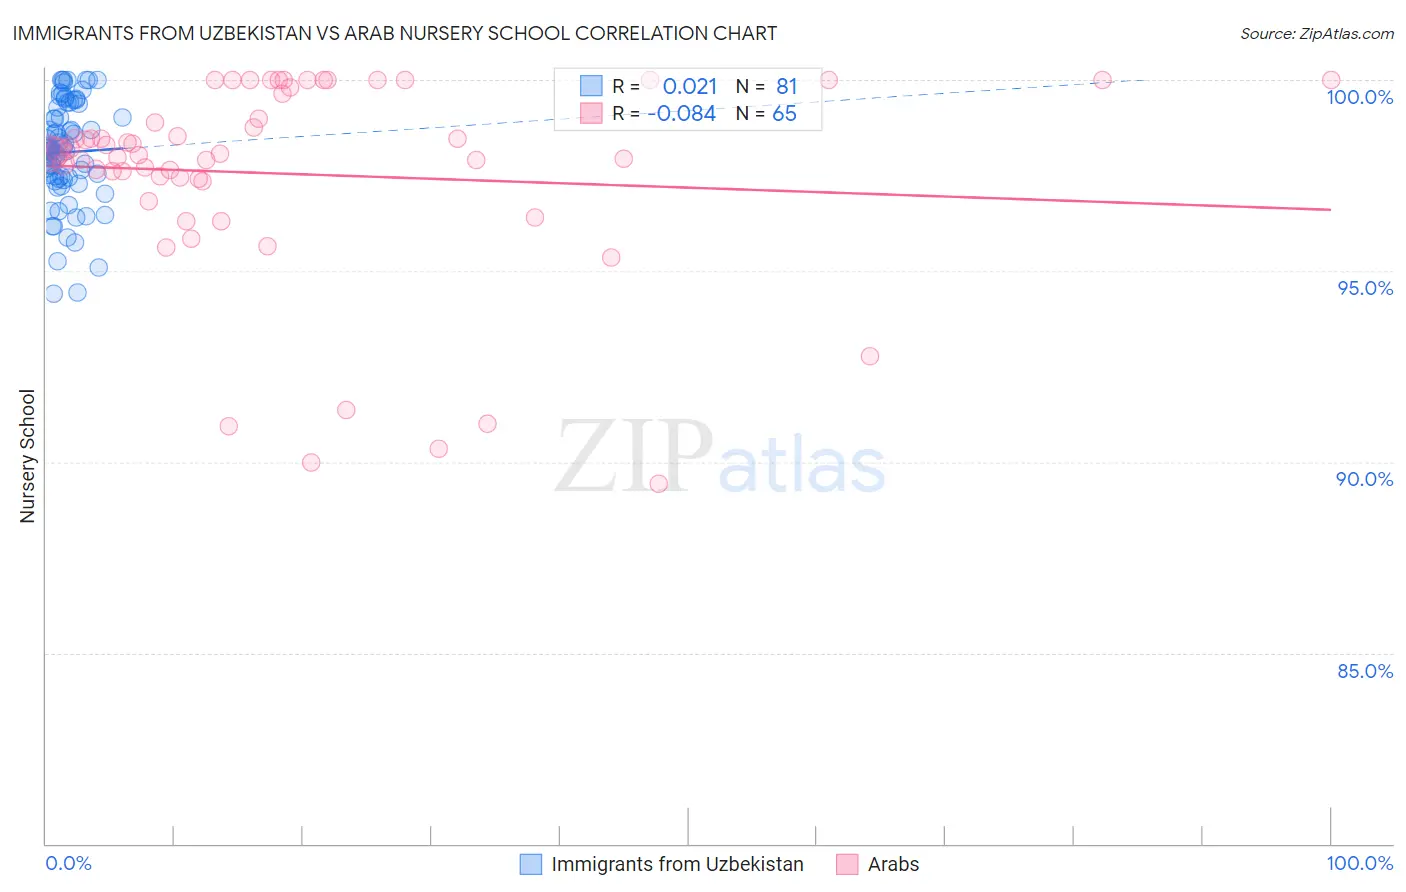
Immigrants from Uzbekistan vs Arab Nursery School Correlation Chart
The statistical analysis conducted on geographies consisting of 118,593,934 people shows no correlation between the proportion of Immigrants from Uzbekistan and percentage of population with at least nursery school education in the United States with a correlation coefficient (R) of 0.021 and weighted average of 97.4%. Similarly, the statistical analysis conducted on geographies consisting of 486,872,066 people shows a slight negative correlation between the proportion of Arabs and percentage of population with at least nursery school education in the United States with a correlation coefficient (R) of -0.084 and weighted average of 97.9%, a difference of 0.51%.
Nursery School Correlation Summary
| Measurement | Immigrants from Uzbekistan | Arab |
| Minimum | 94.4% | 89.4% |
| Maximum | 100.0% | 100.0% |
| Range | 5.6% | 10.6% |
| Mean | 98.1% | 97.5% |
| Median | 98.2% | 98.1% |
| Interquartile 25% (IQ1) | 97.4% | 97.4% |
| Interquartile 75% (IQ3) | 99.3% | 99.7% |
| Interquartile Range (IQR) | 1.9% | 2.3% |
| Standard Deviation (Sample) | 1.3% | 2.7% |
| Standard Deviation (Population) | 1.3% | 2.7% |
Similar Demographics by Nursery School
Demographics Similar to Immigrants from Uzbekistan by Nursery School
In terms of nursery school, the demographic groups most similar to Immigrants from Uzbekistan are Immigrants from Western Africa (97.4%, a difference of 0.010%), Immigrants from Ghana (97.4%, a difference of 0.010%), Barbadian (97.4%, a difference of 0.010%), Trinidadian and Tobagonian (97.4%, a difference of 0.010%), and Afghan (97.4%, a difference of 0.020%).
| Demographics | Rating | Rank | Nursery School |
| Immigrants | Peru | 0.2 /100 | #271 | Tragic 97.5% |
| Immigrants | Bolivia | 0.1 /100 | #272 | Tragic 97.5% |
| Immigrants | China | 0.1 /100 | #273 | Tragic 97.5% |
| Immigrants | Cameroon | 0.1 /100 | #274 | Tragic 97.5% |
| Ghanaians | 0.1 /100 | #275 | Tragic 97.5% |
| Immigrants | Philippines | 0.1 /100 | #276 | Tragic 97.5% |
| Immigrants | Western Africa | 0.1 /100 | #277 | Tragic 97.4% |
| Immigrants | Uzbekistan | 0.1 /100 | #278 | Tragic 97.4% |
| Immigrants | Ghana | 0.1 /100 | #279 | Tragic 97.4% |
| Barbadians | 0.0 /100 | #280 | Tragic 97.4% |
| Trinidadians and Tobagonians | 0.0 /100 | #281 | Tragic 97.4% |
| Afghans | 0.0 /100 | #282 | Tragic 97.4% |
| Immigrants | West Indies | 0.0 /100 | #283 | Tragic 97.4% |
| Immigrants | Trinidad and Tobago | 0.0 /100 | #284 | Tragic 97.4% |
| Immigrants | Barbados | 0.0 /100 | #285 | Tragic 97.4% |
Demographics Similar to Arabs by Nursery School
In terms of nursery school, the demographic groups most similar to Arabs are Pakistani (97.9%, a difference of 0.0%), Panamanian (97.9%, a difference of 0.0%), Immigrants from Kazakhstan (97.9%, a difference of 0.010%), Immigrants from Taiwan (97.9%, a difference of 0.010%), and Paiute (98.0%, a difference of 0.020%).
| Demographics | Rating | Rank | Nursery School |
| Egyptians | 42.8 /100 | #181 | Average 98.0% |
| Paiute | 42.0 /100 | #182 | Average 98.0% |
| Portuguese | 41.8 /100 | #183 | Average 98.0% |
| Immigrants | Poland | 41.3 /100 | #184 | Average 98.0% |
| Immigrants | Belarus | 41.0 /100 | #185 | Average 98.0% |
| Immigrants | Argentina | 40.8 /100 | #186 | Average 98.0% |
| Immigrants | Kazakhstan | 37.1 /100 | #187 | Fair 97.9% |
| Arabs | 34.7 /100 | #188 | Fair 97.9% |
| Pakistanis | 34.6 /100 | #189 | Fair 97.9% |
| Panamanians | 34.3 /100 | #190 | Fair 97.9% |
| Immigrants | Taiwan | 30.6 /100 | #191 | Fair 97.9% |
| Blacks/African Americans | 29.4 /100 | #192 | Fair 97.9% |
| Paraguayans | 27.4 /100 | #193 | Fair 97.9% |
| Mongolians | 27.3 /100 | #194 | Fair 97.9% |
| Hawaiians | 27.2 /100 | #195 | Fair 97.9% |