Immigrants from Peru vs Alsatian Associate's Degree
COMPARE
Immigrants from Peru
Alsatian
Associate's Degree
Associate's Degree Comparison
Immigrants from Peru
Alsatians
45.5%
ASSOCIATE'S DEGREE
27.6/ 100
METRIC RATING
194th/ 347
METRIC RANK
48.8%
ASSOCIATE'S DEGREE
94.6/ 100
METRIC RATING
120th/ 347
METRIC RANK
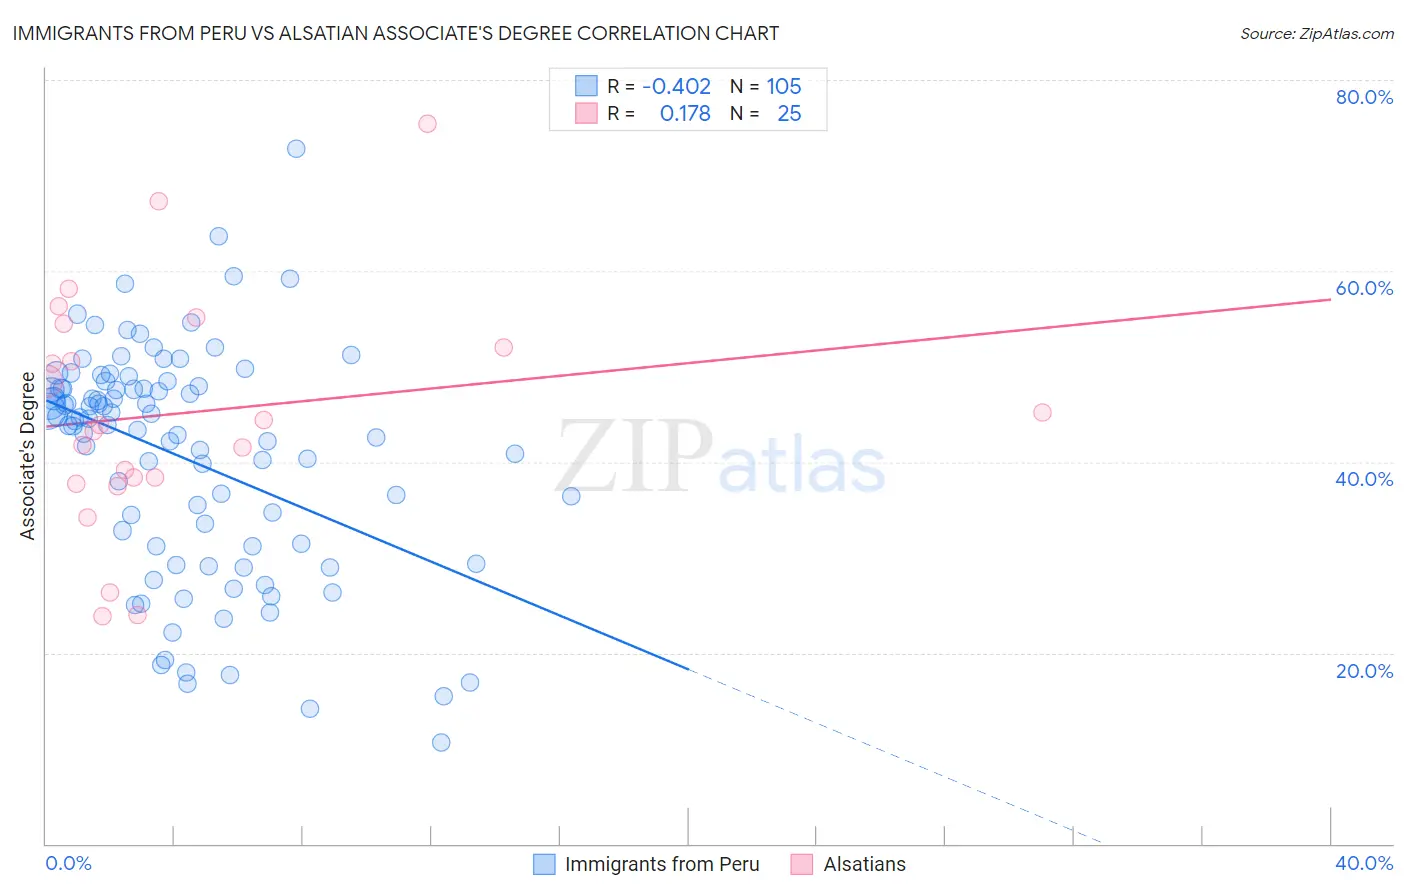
Immigrants from Peru vs Alsatian Associate's Degree Correlation Chart
The statistical analysis conducted on geographies consisting of 328,856,641 people shows a moderate negative correlation between the proportion of Immigrants from Peru and percentage of population with at least associate's degree education in the United States with a correlation coefficient (R) of -0.402 and weighted average of 45.5%. Similarly, the statistical analysis conducted on geographies consisting of 82,682,365 people shows a poor positive correlation between the proportion of Alsatians and percentage of population with at least associate's degree education in the United States with a correlation coefficient (R) of 0.178 and weighted average of 48.8%, a difference of 7.3%.
Associate's Degree Correlation Summary
| Measurement | Immigrants from Peru | Alsatian |
| Minimum | 10.6% | 23.9% |
| Maximum | 72.7% | 75.4% |
| Range | 62.1% | 51.6% |
| Mean | 40.4% | 45.1% |
| Median | 43.8% | 43.9% |
| Interquartile 25% (IQ1) | 31.2% | 38.0% |
| Interquartile 75% (IQ3) | 47.8% | 53.2% |
| Interquartile Range (IQR) | 16.6% | 15.2% |
| Standard Deviation (Sample) | 12.0% | 12.3% |
| Standard Deviation (Population) | 11.9% | 12.1% |
Similar Demographics by Associate's Degree
Demographics Similar to Immigrants from Peru by Associate's Degree
In terms of associate's degree, the demographic groups most similar to Immigrants from Peru are German (45.5%, a difference of 0.10%), French (45.4%, a difference of 0.19%), Immigrants from Cameroon (45.7%, a difference of 0.32%), Celtic (45.8%, a difference of 0.51%), and Scotch-Irish (45.3%, a difference of 0.54%).
| Demographics | Rating | Rank | Associate's Degree |
| Immigrants | Uruguay | 35.5 /100 | #187 | Fair 45.8% |
| Ghanaians | 35.5 /100 | #188 | Fair 45.8% |
| Immigrants | Oceania | 34.7 /100 | #189 | Fair 45.8% |
| Vietnamese | 34.0 /100 | #190 | Fair 45.8% |
| Koreans | 33.8 /100 | #191 | Fair 45.8% |
| Celtics | 33.3 /100 | #192 | Fair 45.8% |
| Immigrants | Cameroon | 31.0 /100 | #193 | Fair 45.7% |
| Immigrants | Peru | 27.6 /100 | #194 | Fair 45.5% |
| Germans | 26.5 /100 | #195 | Fair 45.5% |
| French | 25.6 /100 | #196 | Fair 45.4% |
| Scotch-Irish | 22.3 /100 | #197 | Fair 45.3% |
| Immigrants | Bangladesh | 21.3 /100 | #198 | Fair 45.2% |
| Immigrants | Senegal | 21.2 /100 | #199 | Fair 45.2% |
| Senegalese | 21.1 /100 | #200 | Fair 45.2% |
| Immigrants | Vietnam | 20.8 /100 | #201 | Fair 45.2% |
Demographics Similar to Alsatians by Associate's Degree
In terms of associate's degree, the demographic groups most similar to Alsatians are Lebanese (48.8%, a difference of 0.020%), Albanian (48.8%, a difference of 0.030%), Afghan (48.9%, a difference of 0.10%), British (48.9%, a difference of 0.14%), and Luxembourger (48.9%, a difference of 0.20%).
| Demographics | Rating | Rank | Associate's Degree |
| Palestinians | 95.3 /100 | #113 | Exceptional 49.0% |
| Arabs | 95.3 /100 | #114 | Exceptional 49.0% |
| Luxembourgers | 95.1 /100 | #115 | Exceptional 48.9% |
| British | 95.0 /100 | #116 | Exceptional 48.9% |
| Afghans | 94.8 /100 | #117 | Exceptional 48.9% |
| Albanians | 94.7 /100 | #118 | Exceptional 48.8% |
| Lebanese | 94.6 /100 | #119 | Exceptional 48.8% |
| Alsatians | 94.6 /100 | #120 | Exceptional 48.8% |
| Ugandans | 93.9 /100 | #121 | Exceptional 48.7% |
| Italians | 93.9 /100 | #122 | Exceptional 48.7% |
| Brazilians | 93.7 /100 | #123 | Exceptional 48.7% |
| Serbians | 92.6 /100 | #124 | Exceptional 48.5% |
| Chinese | 92.5 /100 | #125 | Exceptional 48.5% |
| Immigrants | Syria | 92.2 /100 | #126 | Exceptional 48.5% |
| Immigrants | Uganda | 92.1 /100 | #127 | Exceptional 48.5% |