Syrian vs Immigrants from Nepal Professional Degree
COMPARE
Syrian
Immigrants from Nepal
Professional Degree
Professional Degree Comparison
Syrians
Immigrants from Nepal
5.2%
PROFESSIONAL DEGREE
99.1/ 100
METRIC RATING
97th/ 347
METRIC RANK
4.8%
PROFESSIONAL DEGREE
91.4/ 100
METRIC RATING
131st/ 347
METRIC RANK
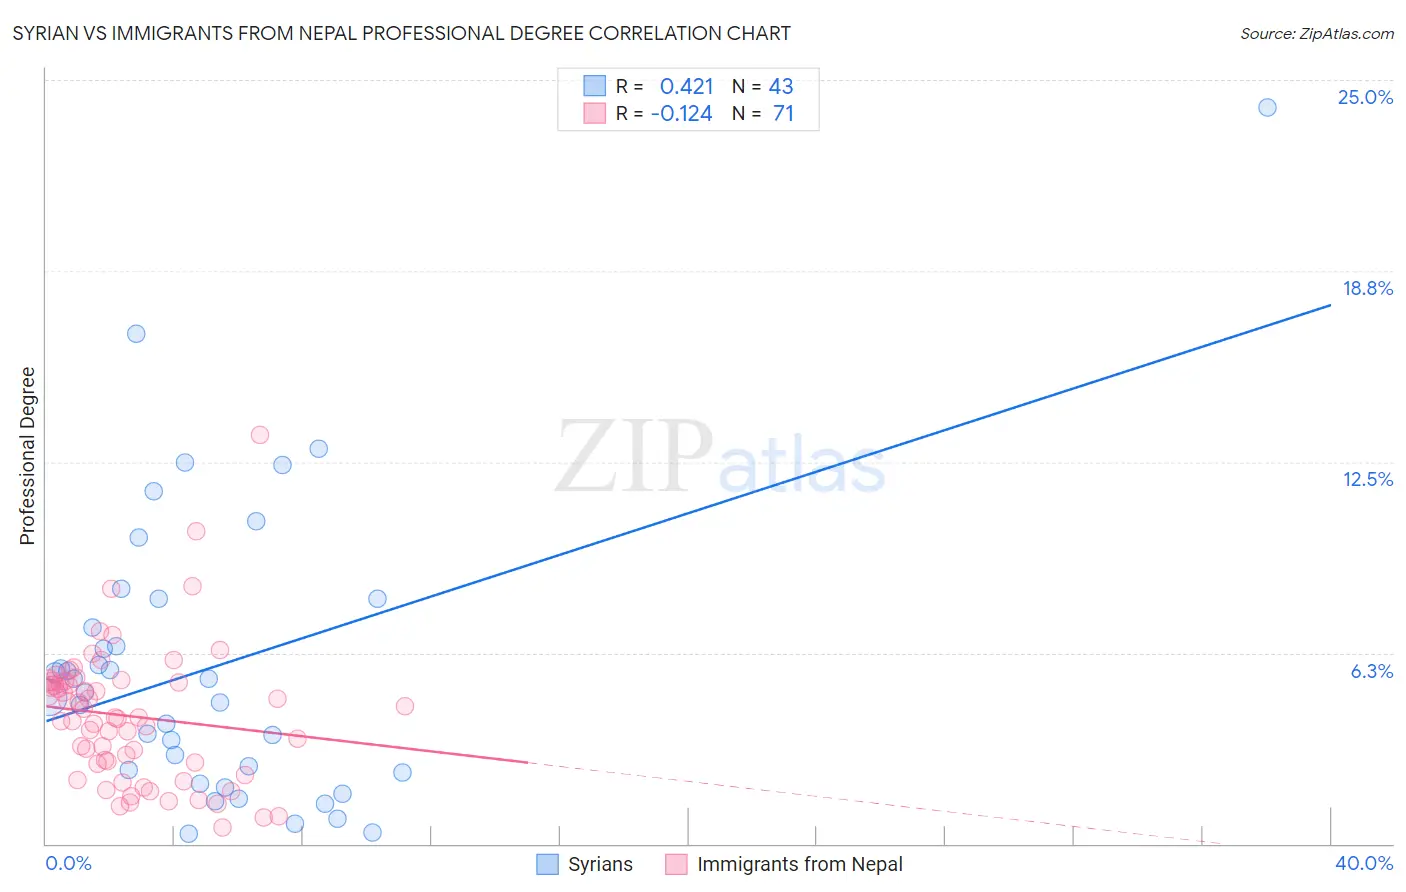
Syrian vs Immigrants from Nepal Professional Degree Correlation Chart
The statistical analysis conducted on geographies consisting of 266,047,589 people shows a moderate positive correlation between the proportion of Syrians and percentage of population with at least professional degree education in the United States with a correlation coefficient (R) of 0.421 and weighted average of 5.2%. Similarly, the statistical analysis conducted on geographies consisting of 186,663,836 people shows a poor negative correlation between the proportion of Immigrants from Nepal and percentage of population with at least professional degree education in the United States with a correlation coefficient (R) of -0.124 and weighted average of 4.8%, a difference of 7.8%.
Professional Degree Correlation Summary
| Measurement | Syrian | Immigrants from Nepal |
| Minimum | 0.32% | 0.52% |
| Maximum | 24.1% | 13.4% |
| Range | 23.8% | 12.9% |
| Mean | 5.8% | 4.2% |
| Median | 5.0% | 4.1% |
| Interquartile 25% (IQ1) | 2.3% | 2.6% |
| Interquartile 75% (IQ3) | 8.0% | 5.3% |
| Interquartile Range (IQR) | 5.7% | 2.7% |
| Standard Deviation (Sample) | 4.8% | 2.2% |
| Standard Deviation (Population) | 4.7% | 2.2% |
Similar Demographics by Professional Degree
Demographics Similar to Syrians by Professional Degree
In terms of professional degree, the demographic groups most similar to Syrians are Austrian (5.2%, a difference of 0.020%), Immigrants from Italy (5.2%, a difference of 0.080%), Immigrants from Uzbekistan (5.2%, a difference of 0.35%), Zimbabwean (5.2%, a difference of 0.75%), and Ugandan (5.1%, a difference of 0.85%).
| Demographics | Rating | Rank | Professional Degree |
| Immigrants | Scotland | 99.5 /100 | #90 | Exceptional 5.3% |
| Laotians | 99.5 /100 | #91 | Exceptional 5.2% |
| Immigrants | Eastern Europe | 99.5 /100 | #92 | Exceptional 5.2% |
| Northern Europeans | 99.3 /100 | #93 | Exceptional 5.2% |
| Alsatians | 99.3 /100 | #94 | Exceptional 5.2% |
| Zimbabweans | 99.3 /100 | #95 | Exceptional 5.2% |
| Immigrants | Uzbekistan | 99.2 /100 | #96 | Exceptional 5.2% |
| Syrians | 99.1 /100 | #97 | Exceptional 5.2% |
| Austrians | 99.1 /100 | #98 | Exceptional 5.2% |
| Immigrants | Italy | 99.1 /100 | #99 | Exceptional 5.2% |
| Ugandans | 98.8 /100 | #100 | Exceptional 5.1% |
| Immigrants | Egypt | 98.5 /100 | #101 | Exceptional 5.1% |
| Ukrainians | 98.5 /100 | #102 | Exceptional 5.1% |
| Immigrants | Northern Africa | 98.4 /100 | #103 | Exceptional 5.1% |
| Arabs | 98.2 /100 | #104 | Exceptional 5.0% |
Demographics Similar to Immigrants from Nepal by Professional Degree
In terms of professional degree, the demographic groups most similar to Immigrants from Nepal are Icelander (4.8%, a difference of 0.030%), Palestinian (4.8%, a difference of 0.050%), Pakistani (4.8%, a difference of 0.22%), Italian (4.8%, a difference of 0.48%), and Immigrants from Eastern Africa (4.8%, a difference of 0.51%).
| Demographics | Rating | Rank | Professional Degree |
| Immigrants | Eritrea | 93.5 /100 | #124 | Exceptional 4.8% |
| Immigrants | Albania | 93.3 /100 | #125 | Exceptional 4.8% |
| Europeans | 93.2 /100 | #126 | Exceptional 4.8% |
| Serbians | 92.6 /100 | #127 | Exceptional 4.8% |
| Immigrants | Eastern Africa | 92.5 /100 | #128 | Exceptional 4.8% |
| Palestinians | 91.5 /100 | #129 | Exceptional 4.8% |
| Icelanders | 91.5 /100 | #130 | Exceptional 4.8% |
| Immigrants | Nepal | 91.4 /100 | #131 | Exceptional 4.8% |
| Pakistanis | 90.9 /100 | #132 | Exceptional 4.8% |
| Italians | 90.2 /100 | #133 | Exceptional 4.8% |
| South American Indians | 89.9 /100 | #134 | Excellent 4.8% |
| Macedonians | 89.8 /100 | #135 | Excellent 4.8% |
| Immigrants | Jordan | 89.0 /100 | #136 | Excellent 4.7% |
| Jordanians | 88.9 /100 | #137 | Excellent 4.7% |
| Afghans | 88.8 /100 | #138 | Excellent 4.7% |