Lumbee vs Immigrants from Nepal Professional Degree
COMPARE
Lumbee
Immigrants from Nepal
Professional Degree
Professional Degree Comparison
Lumbee
Immigrants from Nepal
2.5%
PROFESSIONAL DEGREE
0.0/ 100
METRIC RATING
346th/ 347
METRIC RANK
4.8%
PROFESSIONAL DEGREE
91.4/ 100
METRIC RATING
131st/ 347
METRIC RANK
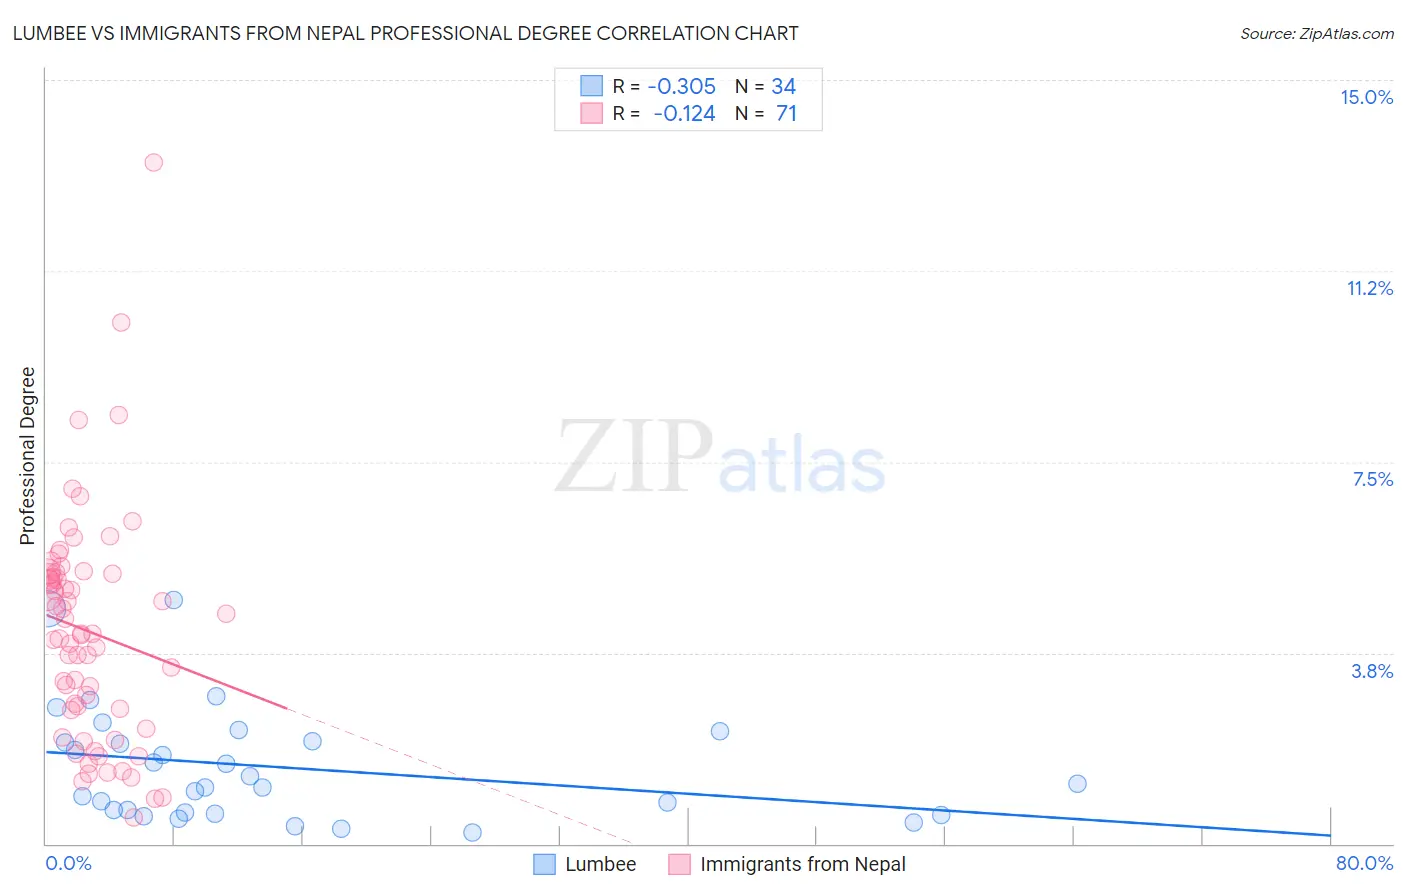
Lumbee vs Immigrants from Nepal Professional Degree Correlation Chart
The statistical analysis conducted on geographies consisting of 92,157,121 people shows a mild negative correlation between the proportion of Lumbee and percentage of population with at least professional degree education in the United States with a correlation coefficient (R) of -0.305 and weighted average of 2.5%. Similarly, the statistical analysis conducted on geographies consisting of 186,663,836 people shows a poor negative correlation between the proportion of Immigrants from Nepal and percentage of population with at least professional degree education in the United States with a correlation coefficient (R) of -0.124 and weighted average of 4.8%, a difference of 94.3%.
Professional Degree Correlation Summary
| Measurement | Lumbee | Immigrants from Nepal |
| Minimum | 0.22% | 0.52% |
| Maximum | 4.8% | 13.4% |
| Range | 4.6% | 12.9% |
| Mean | 1.5% | 4.2% |
| Median | 1.1% | 4.1% |
| Interquartile 25% (IQ1) | 0.60% | 2.6% |
| Interquartile 75% (IQ3) | 2.0% | 5.3% |
| Interquartile Range (IQR) | 1.4% | 2.7% |
| Standard Deviation (Sample) | 1.1% | 2.2% |
| Standard Deviation (Population) | 1.1% | 2.2% |
Similar Demographics by Professional Degree
Demographics Similar to Lumbee by Professional Degree
In terms of professional degree, the demographic groups most similar to Lumbee are Immigrants from Mexico (2.6%, a difference of 7.4%), Spanish American Indian (2.7%, a difference of 7.7%), Houma (2.2%, a difference of 11.1%), Mexican (2.7%, a difference of 11.7%), and Immigrants from the Azores (2.8%, a difference of 14.8%).
| Demographics | Rating | Rank | Professional Degree |
| Puget Sound Salish | 0.0 /100 | #333 | Tragic 3.1% |
| Pennsylvania Germans | 0.0 /100 | #334 | Tragic 3.0% |
| Natives/Alaskans | 0.0 /100 | #335 | Tragic 3.0% |
| Fijians | 0.0 /100 | #336 | Tragic 2.9% |
| Arapaho | 0.0 /100 | #337 | Tragic 2.9% |
| Navajo | 0.0 /100 | #338 | Tragic 2.9% |
| Immigrants | Central America | 0.0 /100 | #339 | Tragic 2.9% |
| Yup'ik | 0.0 /100 | #340 | Tragic 2.9% |
| Tohono O'odham | 0.0 /100 | #341 | Tragic 2.8% |
| Immigrants | Azores | 0.0 /100 | #342 | Tragic 2.8% |
| Mexicans | 0.0 /100 | #343 | Tragic 2.7% |
| Spanish American Indians | 0.0 /100 | #344 | Tragic 2.7% |
| Immigrants | Mexico | 0.0 /100 | #345 | Tragic 2.6% |
| Lumbee | 0.0 /100 | #346 | Tragic 2.5% |
| Houma | 0.0 /100 | #347 | Tragic 2.2% |
Demographics Similar to Immigrants from Nepal by Professional Degree
In terms of professional degree, the demographic groups most similar to Immigrants from Nepal are Icelander (4.8%, a difference of 0.030%), Palestinian (4.8%, a difference of 0.050%), Pakistani (4.8%, a difference of 0.22%), Italian (4.8%, a difference of 0.48%), and Immigrants from Eastern Africa (4.8%, a difference of 0.51%).
| Demographics | Rating | Rank | Professional Degree |
| Immigrants | Eritrea | 93.5 /100 | #124 | Exceptional 4.8% |
| Immigrants | Albania | 93.3 /100 | #125 | Exceptional 4.8% |
| Europeans | 93.2 /100 | #126 | Exceptional 4.8% |
| Serbians | 92.6 /100 | #127 | Exceptional 4.8% |
| Immigrants | Eastern Africa | 92.5 /100 | #128 | Exceptional 4.8% |
| Palestinians | 91.5 /100 | #129 | Exceptional 4.8% |
| Icelanders | 91.5 /100 | #130 | Exceptional 4.8% |
| Immigrants | Nepal | 91.4 /100 | #131 | Exceptional 4.8% |
| Pakistanis | 90.9 /100 | #132 | Exceptional 4.8% |
| Italians | 90.2 /100 | #133 | Exceptional 4.8% |
| South American Indians | 89.9 /100 | #134 | Excellent 4.8% |
| Macedonians | 89.8 /100 | #135 | Excellent 4.8% |
| Immigrants | Jordan | 89.0 /100 | #136 | Excellent 4.7% |
| Jordanians | 88.9 /100 | #137 | Excellent 4.7% |
| Afghans | 88.8 /100 | #138 | Excellent 4.7% |