Czech vs Immigrants from Nepal Professional Degree
COMPARE
Czech
Immigrants from Nepal
Professional Degree
Professional Degree Comparison
Czechs
Immigrants from Nepal
4.4%
PROFESSIONAL DEGREE
44.9/ 100
METRIC RATING
180th/ 347
METRIC RANK
4.8%
PROFESSIONAL DEGREE
91.4/ 100
METRIC RATING
131st/ 347
METRIC RANK
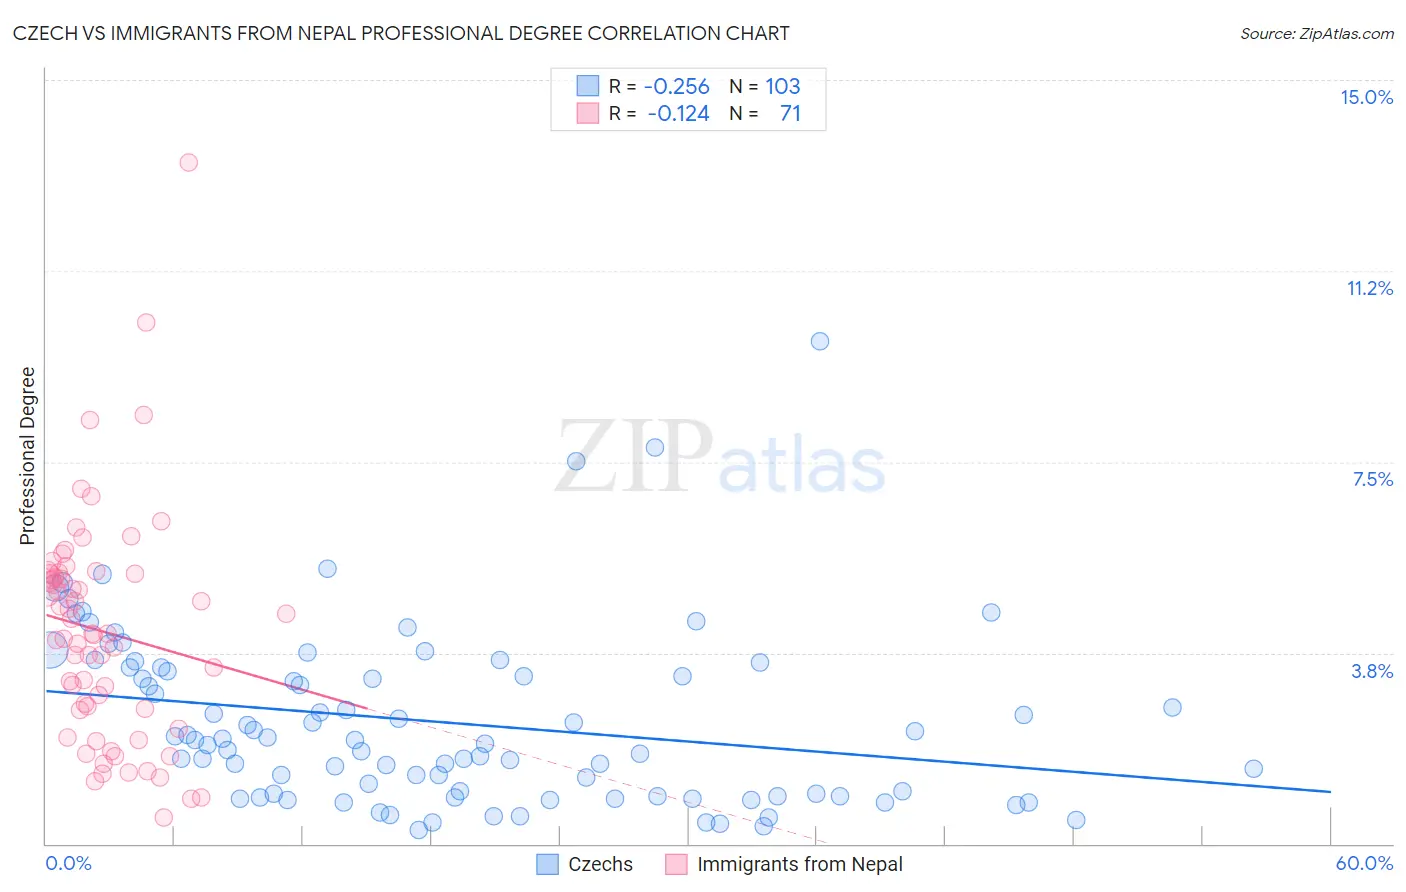
Czech vs Immigrants from Nepal Professional Degree Correlation Chart
The statistical analysis conducted on geographies consisting of 481,986,557 people shows a weak negative correlation between the proportion of Czechs and percentage of population with at least professional degree education in the United States with a correlation coefficient (R) of -0.256 and weighted average of 4.4%. Similarly, the statistical analysis conducted on geographies consisting of 186,663,836 people shows a poor negative correlation between the proportion of Immigrants from Nepal and percentage of population with at least professional degree education in the United States with a correlation coefficient (R) of -0.124 and weighted average of 4.8%, a difference of 9.4%.
Professional Degree Correlation Summary
| Measurement | Czech | Immigrants from Nepal |
| Minimum | 0.26% | 0.52% |
| Maximum | 9.9% | 13.4% |
| Range | 9.6% | 12.9% |
| Mean | 2.4% | 4.2% |
| Median | 2.0% | 4.1% |
| Interquartile 25% (IQ1) | 0.93% | 2.6% |
| Interquartile 75% (IQ3) | 3.5% | 5.3% |
| Interquartile Range (IQR) | 2.5% | 2.7% |
| Standard Deviation (Sample) | 1.7% | 2.2% |
| Standard Deviation (Population) | 1.7% | 2.2% |
Similar Demographics by Professional Degree
Demographics Similar to Czechs by Professional Degree
In terms of professional degree, the demographic groups most similar to Czechs are Immigrants from Kenya (4.4%, a difference of 0.15%), Danish (4.4%, a difference of 0.22%), Immigrants from Costa Rica (4.4%, a difference of 0.26%), Immigrants (4.4%, a difference of 0.26%), and Bermudan (4.4%, a difference of 0.28%).
| Demographics | Rating | Rank | Professional Degree |
| English | 50.1 /100 | #173 | Average 4.4% |
| Kenyans | 50.0 /100 | #174 | Average 4.4% |
| Irish | 50.0 /100 | #175 | Average 4.4% |
| Immigrants | Peru | 49.3 /100 | #176 | Average 4.4% |
| Celtics | 47.6 /100 | #177 | Average 4.4% |
| Immigrants | Costa Rica | 46.7 /100 | #178 | Average 4.4% |
| Immigrants | Kenya | 45.9 /100 | #179 | Average 4.4% |
| Czechs | 44.9 /100 | #180 | Average 4.4% |
| Danes | 43.5 /100 | #181 | Average 4.4% |
| Immigrants | Immigrants | 43.2 /100 | #182 | Average 4.4% |
| Bermudans | 43.1 /100 | #183 | Average 4.4% |
| Belgians | 36.2 /100 | #184 | Fair 4.3% |
| Welsh | 35.8 /100 | #185 | Fair 4.3% |
| Scotch-Irish | 34.2 /100 | #186 | Fair 4.3% |
| Immigrants | Cameroon | 33.3 /100 | #187 | Fair 4.3% |
Demographics Similar to Immigrants from Nepal by Professional Degree
In terms of professional degree, the demographic groups most similar to Immigrants from Nepal are Icelander (4.8%, a difference of 0.030%), Palestinian (4.8%, a difference of 0.050%), Pakistani (4.8%, a difference of 0.22%), Italian (4.8%, a difference of 0.48%), and Immigrants from Eastern Africa (4.8%, a difference of 0.51%).
| Demographics | Rating | Rank | Professional Degree |
| Immigrants | Eritrea | 93.5 /100 | #124 | Exceptional 4.8% |
| Immigrants | Albania | 93.3 /100 | #125 | Exceptional 4.8% |
| Europeans | 93.2 /100 | #126 | Exceptional 4.8% |
| Serbians | 92.6 /100 | #127 | Exceptional 4.8% |
| Immigrants | Eastern Africa | 92.5 /100 | #128 | Exceptional 4.8% |
| Palestinians | 91.5 /100 | #129 | Exceptional 4.8% |
| Icelanders | 91.5 /100 | #130 | Exceptional 4.8% |
| Immigrants | Nepal | 91.4 /100 | #131 | Exceptional 4.8% |
| Pakistanis | 90.9 /100 | #132 | Exceptional 4.8% |
| Italians | 90.2 /100 | #133 | Exceptional 4.8% |
| South American Indians | 89.9 /100 | #134 | Excellent 4.8% |
| Macedonians | 89.8 /100 | #135 | Excellent 4.8% |
| Immigrants | Jordan | 89.0 /100 | #136 | Excellent 4.7% |
| Jordanians | 88.9 /100 | #137 | Excellent 4.7% |
| Afghans | 88.8 /100 | #138 | Excellent 4.7% |