Spanish American vs Immigrants from Eastern Asia Associate's Degree
COMPARE
Spanish American
Immigrants from Eastern Asia
Associate's Degree
Associate's Degree Comparison
Spanish Americans
Immigrants from Eastern Asia
41.8%
ASSOCIATE'S DEGREE
0.5/ 100
METRIC RATING
257th/ 347
METRIC RANK
55.4%
ASSOCIATE'S DEGREE
100.0/ 100
METRIC RATING
15th/ 347
METRIC RANK
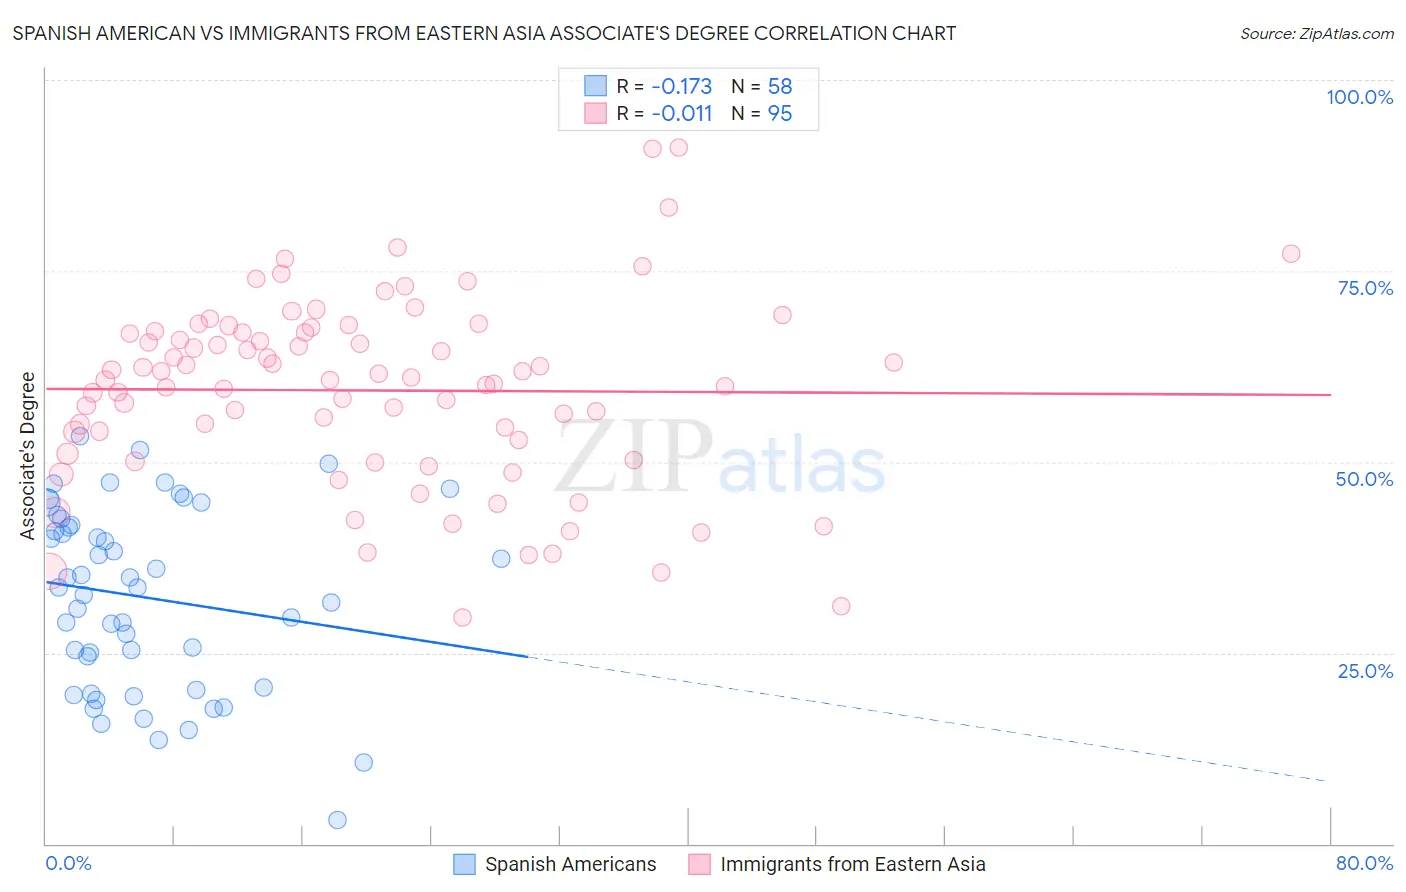
Spanish American vs Immigrants from Eastern Asia Associate's Degree Correlation Chart
The statistical analysis conducted on geographies consisting of 103,167,704 people shows a poor negative correlation between the proportion of Spanish Americans and percentage of population with at least associate's degree education in the United States with a correlation coefficient (R) of -0.173 and weighted average of 41.8%. Similarly, the statistical analysis conducted on geographies consisting of 499,873,400 people shows no correlation between the proportion of Immigrants from Eastern Asia and percentage of population with at least associate's degree education in the United States with a correlation coefficient (R) of -0.011 and weighted average of 55.4%, a difference of 32.6%.
Associate's Degree Correlation Summary
| Measurement | Spanish American | Immigrants from Eastern Asia |
| Minimum | 3.1% | 29.6% |
| Maximum | 53.4% | 91.1% |
| Range | 50.3% | 61.5% |
| Mean | 32.2% | 59.3% |
| Median | 33.5% | 60.8% |
| Interquartile 25% (IQ1) | 20.5% | 51.1% |
| Interquartile 75% (IQ3) | 41.7% | 66.9% |
| Interquartile Range (IQR) | 21.2% | 15.8% |
| Standard Deviation (Sample) | 11.9% | 12.2% |
| Standard Deviation (Population) | 11.8% | 12.2% |
Similar Demographics by Associate's Degree
Demographics Similar to Spanish Americans by Associate's Degree
In terms of associate's degree, the demographic groups most similar to Spanish Americans are Immigrants from Congo (41.8%, a difference of 0.060%), Immigrants from Guyana (41.8%, a difference of 0.18%), Japanese (41.7%, a difference of 0.22%), Cuban (41.9%, a difference of 0.27%), and Malaysian (41.6%, a difference of 0.32%).
| Demographics | Rating | Rank | Associate's Degree |
| U.S. Virgin Islanders | 0.7 /100 | #250 | Tragic 42.1% |
| Immigrants | Bahamas | 0.7 /100 | #251 | Tragic 42.1% |
| French American Indians | 0.6 /100 | #252 | Tragic 42.0% |
| Indonesians | 0.6 /100 | #253 | Tragic 41.9% |
| Cubans | 0.6 /100 | #254 | Tragic 41.9% |
| Immigrants | Guyana | 0.5 /100 | #255 | Tragic 41.8% |
| Immigrants | Congo | 0.5 /100 | #256 | Tragic 41.8% |
| Spanish Americans | 0.5 /100 | #257 | Tragic 41.8% |
| Japanese | 0.5 /100 | #258 | Tragic 41.7% |
| Malaysians | 0.4 /100 | #259 | Tragic 41.6% |
| Marshallese | 0.4 /100 | #260 | Tragic 41.6% |
| Nicaraguans | 0.4 /100 | #261 | Tragic 41.5% |
| Bahamians | 0.4 /100 | #262 | Tragic 41.5% |
| Immigrants | Jamaica | 0.3 /100 | #263 | Tragic 41.5% |
| Osage | 0.3 /100 | #264 | Tragic 41.5% |
Demographics Similar to Immigrants from Eastern Asia by Associate's Degree
In terms of associate's degree, the demographic groups most similar to Immigrants from Eastern Asia are Immigrants from Hong Kong (55.4%, a difference of 0.030%), Immigrants from China (55.5%, a difference of 0.17%), Soviet Union (55.1%, a difference of 0.47%), Eastern European (55.0%, a difference of 0.61%), and Immigrants from South Central Asia (55.7%, a difference of 0.67%).
| Demographics | Rating | Rank | Associate's Degree |
| Thais | 100.0 /100 | #8 | Exceptional 57.4% |
| Immigrants | Israel | 100.0 /100 | #9 | Exceptional 56.8% |
| Cypriots | 100.0 /100 | #10 | Exceptional 56.4% |
| Immigrants | Australia | 100.0 /100 | #11 | Exceptional 55.8% |
| Immigrants | South Central Asia | 100.0 /100 | #12 | Exceptional 55.7% |
| Immigrants | China | 100.0 /100 | #13 | Exceptional 55.5% |
| Immigrants | Hong Kong | 100.0 /100 | #14 | Exceptional 55.4% |
| Immigrants | Eastern Asia | 100.0 /100 | #15 | Exceptional 55.4% |
| Soviet Union | 100.0 /100 | #16 | Exceptional 55.1% |
| Eastern Europeans | 100.0 /100 | #17 | Exceptional 55.0% |
| Indians (Asian) | 100.0 /100 | #18 | Exceptional 54.8% |
| Immigrants | Ireland | 100.0 /100 | #19 | Exceptional 54.7% |
| Cambodians | 100.0 /100 | #20 | Exceptional 54.6% |
| Immigrants | Sweden | 100.0 /100 | #21 | Exceptional 54.6% |
| Immigrants | Japan | 100.0 /100 | #22 | Exceptional 54.6% |