Spanish American Indian vs Ukrainian Professional Degree
COMPARE
Spanish American Indian
Ukrainian
Professional Degree
Professional Degree Comparison
Spanish American Indians
Ukrainians
2.7%
PROFESSIONAL DEGREE
0.0/ 100
METRIC RATING
344th/ 347
METRIC RANK
5.1%
PROFESSIONAL DEGREE
98.5/ 100
METRIC RATING
102nd/ 347
METRIC RANK
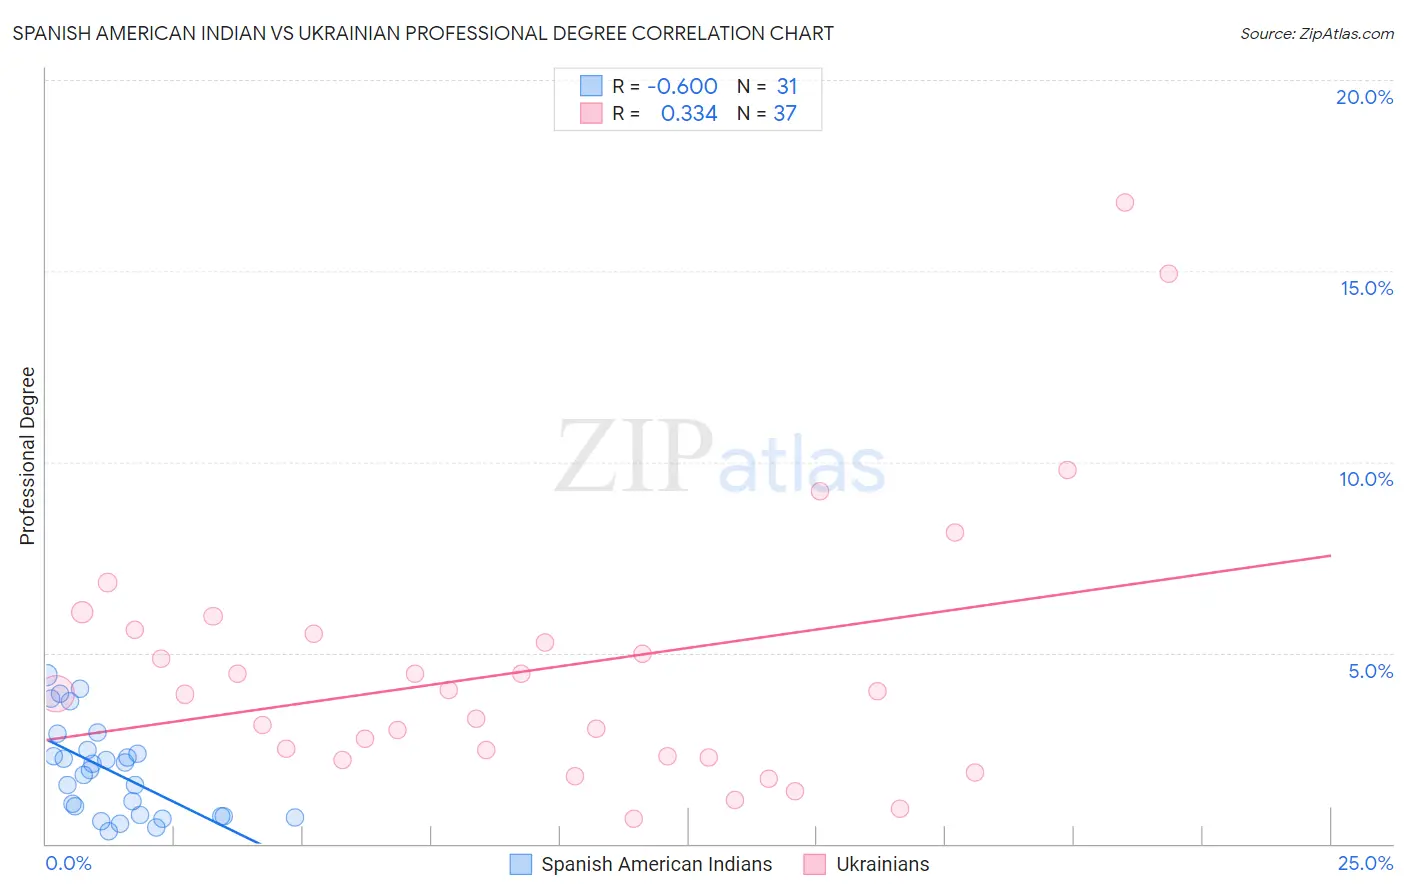
Spanish American Indian vs Ukrainian Professional Degree Correlation Chart
The statistical analysis conducted on geographies consisting of 73,088,569 people shows a significant negative correlation between the proportion of Spanish American Indians and percentage of population with at least professional degree education in the United States with a correlation coefficient (R) of -0.600 and weighted average of 2.7%. Similarly, the statistical analysis conducted on geographies consisting of 447,148,377 people shows a mild positive correlation between the proportion of Ukrainians and percentage of population with at least professional degree education in the United States with a correlation coefficient (R) of 0.334 and weighted average of 5.1%, a difference of 91.2%.
Professional Degree Correlation Summary
| Measurement | Spanish American Indian | Ukrainian |
| Minimum | 0.32% | 0.66% |
| Maximum | 4.4% | 16.8% |
| Range | 4.1% | 16.1% |
| Mean | 1.9% | 4.6% |
| Median | 1.9% | 3.9% |
| Interquartile 25% (IQ1) | 0.71% | 2.3% |
| Interquartile 75% (IQ3) | 2.4% | 5.5% |
| Interquartile Range (IQR) | 1.7% | 3.3% |
| Standard Deviation (Sample) | 1.2% | 3.5% |
| Standard Deviation (Population) | 1.2% | 3.5% |
Similar Demographics by Professional Degree
Demographics Similar to Spanish American Indians by Professional Degree
In terms of professional degree, the demographic groups most similar to Spanish American Indians are Immigrants from Mexico (2.6%, a difference of 0.32%), Mexican (2.7%, a difference of 3.6%), Immigrants from the Azores (2.8%, a difference of 6.6%), Tohono O'odham (2.8%, a difference of 7.3%), and Lumbee (2.5%, a difference of 7.7%).
| Demographics | Rating | Rank | Professional Degree |
| Puget Sound Salish | 0.0 /100 | #333 | Tragic 3.1% |
| Pennsylvania Germans | 0.0 /100 | #334 | Tragic 3.0% |
| Natives/Alaskans | 0.0 /100 | #335 | Tragic 3.0% |
| Fijians | 0.0 /100 | #336 | Tragic 2.9% |
| Arapaho | 0.0 /100 | #337 | Tragic 2.9% |
| Navajo | 0.0 /100 | #338 | Tragic 2.9% |
| Immigrants | Central America | 0.0 /100 | #339 | Tragic 2.9% |
| Yup'ik | 0.0 /100 | #340 | Tragic 2.9% |
| Tohono O'odham | 0.0 /100 | #341 | Tragic 2.8% |
| Immigrants | Azores | 0.0 /100 | #342 | Tragic 2.8% |
| Mexicans | 0.0 /100 | #343 | Tragic 2.7% |
| Spanish American Indians | 0.0 /100 | #344 | Tragic 2.7% |
| Immigrants | Mexico | 0.0 /100 | #345 | Tragic 2.6% |
| Lumbee | 0.0 /100 | #346 | Tragic 2.5% |
| Houma | 0.0 /100 | #347 | Tragic 2.2% |
Demographics Similar to Ukrainians by Professional Degree
In terms of professional degree, the demographic groups most similar to Ukrainians are Immigrants from Egypt (5.1%, a difference of 0.080%), Immigrants from Northern Africa (5.1%, a difference of 0.25%), Arab (5.0%, a difference of 0.56%), Immigrants from Uganda (5.0%, a difference of 0.59%), and Immigrants from Ukraine (5.0%, a difference of 0.62%).
| Demographics | Rating | Rank | Professional Degree |
| Zimbabweans | 99.3 /100 | #95 | Exceptional 5.2% |
| Immigrants | Uzbekistan | 99.2 /100 | #96 | Exceptional 5.2% |
| Syrians | 99.1 /100 | #97 | Exceptional 5.2% |
| Austrians | 99.1 /100 | #98 | Exceptional 5.2% |
| Immigrants | Italy | 99.1 /100 | #99 | Exceptional 5.2% |
| Ugandans | 98.8 /100 | #100 | Exceptional 5.1% |
| Immigrants | Egypt | 98.5 /100 | #101 | Exceptional 5.1% |
| Ukrainians | 98.5 /100 | #102 | Exceptional 5.1% |
| Immigrants | Northern Africa | 98.4 /100 | #103 | Exceptional 5.1% |
| Arabs | 98.2 /100 | #104 | Exceptional 5.0% |
| Immigrants | Uganda | 98.2 /100 | #105 | Exceptional 5.0% |
| Immigrants | Ukraine | 98.2 /100 | #106 | Exceptional 5.0% |
| Maltese | 98.1 /100 | #107 | Exceptional 5.0% |
| Immigrants | Southern Europe | 98.1 /100 | #108 | Exceptional 5.0% |
| British | 98.0 /100 | #109 | Exceptional 5.0% |