Spanish American Indian vs Sierra Leonean Professional Degree
COMPARE
Spanish American Indian
Sierra Leonean
Professional Degree
Professional Degree Comparison
Spanish American Indians
Sierra Leoneans
2.7%
PROFESSIONAL DEGREE
0.0/ 100
METRIC RATING
344th/ 347
METRIC RANK
4.5%
PROFESSIONAL DEGREE
64.3/ 100
METRIC RATING
163rd/ 347
METRIC RANK
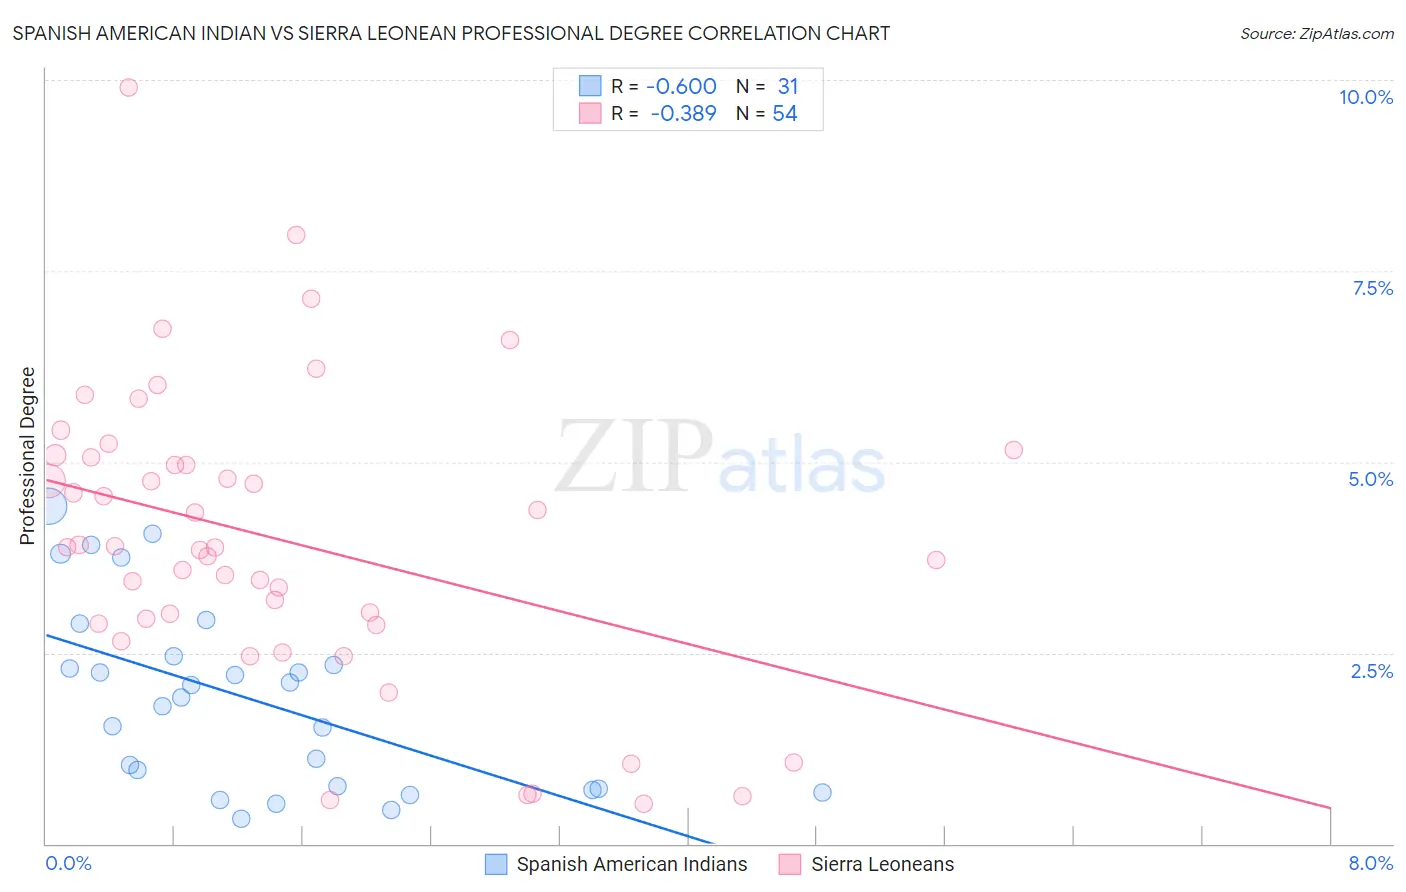
Spanish American Indian vs Sierra Leonean Professional Degree Correlation Chart
The statistical analysis conducted on geographies consisting of 73,088,569 people shows a significant negative correlation between the proportion of Spanish American Indians and percentage of population with at least professional degree education in the United States with a correlation coefficient (R) of -0.600 and weighted average of 2.7%. Similarly, the statistical analysis conducted on geographies consisting of 83,321,250 people shows a mild negative correlation between the proportion of Sierra Leoneans and percentage of population with at least professional degree education in the United States with a correlation coefficient (R) of -0.389 and weighted average of 4.5%, a difference of 69.7%.
Professional Degree Correlation Summary
| Measurement | Spanish American Indian | Sierra Leonean |
| Minimum | 0.32% | 0.52% |
| Maximum | 4.4% | 9.9% |
| Range | 4.1% | 9.4% |
| Mean | 1.9% | 4.0% |
| Median | 1.9% | 3.9% |
| Interquartile 25% (IQ1) | 0.71% | 2.9% |
| Interquartile 75% (IQ3) | 2.4% | 5.1% |
| Interquartile Range (IQR) | 1.7% | 2.2% |
| Standard Deviation (Sample) | 1.2% | 1.9% |
| Standard Deviation (Population) | 1.2% | 1.9% |
Similar Demographics by Professional Degree
Demographics Similar to Spanish American Indians by Professional Degree
In terms of professional degree, the demographic groups most similar to Spanish American Indians are Immigrants from Mexico (2.6%, a difference of 0.32%), Mexican (2.7%, a difference of 3.6%), Immigrants from the Azores (2.8%, a difference of 6.6%), Tohono O'odham (2.8%, a difference of 7.3%), and Lumbee (2.5%, a difference of 7.7%).
| Demographics | Rating | Rank | Professional Degree |
| Puget Sound Salish | 0.0 /100 | #333 | Tragic 3.1% |
| Pennsylvania Germans | 0.0 /100 | #334 | Tragic 3.0% |
| Natives/Alaskans | 0.0 /100 | #335 | Tragic 3.0% |
| Fijians | 0.0 /100 | #336 | Tragic 2.9% |
| Arapaho | 0.0 /100 | #337 | Tragic 2.9% |
| Navajo | 0.0 /100 | #338 | Tragic 2.9% |
| Immigrants | Central America | 0.0 /100 | #339 | Tragic 2.9% |
| Yup'ik | 0.0 /100 | #340 | Tragic 2.9% |
| Tohono O'odham | 0.0 /100 | #341 | Tragic 2.8% |
| Immigrants | Azores | 0.0 /100 | #342 | Tragic 2.8% |
| Mexicans | 0.0 /100 | #343 | Tragic 2.7% |
| Spanish American Indians | 0.0 /100 | #344 | Tragic 2.7% |
| Immigrants | Mexico | 0.0 /100 | #345 | Tragic 2.6% |
| Lumbee | 0.0 /100 | #346 | Tragic 2.5% |
| Houma | 0.0 /100 | #347 | Tragic 2.2% |
Demographics Similar to Sierra Leoneans by Professional Degree
In terms of professional degree, the demographic groups most similar to Sierra Leoneans are Peruvian (4.5%, a difference of 0.14%), Assyrian/Chaldean/Syriac (4.5%, a difference of 0.48%), Swiss (4.5%, a difference of 0.50%), Immigrants from Senegal (4.5%, a difference of 0.59%), and Vietnamese (4.5%, a difference of 0.64%).
| Demographics | Rating | Rank | Professional Degree |
| Swedes | 69.9 /100 | #156 | Good 4.5% |
| Iraqis | 69.8 /100 | #157 | Good 4.5% |
| Immigrants | Armenia | 68.8 /100 | #158 | Good 4.5% |
| Vietnamese | 68.4 /100 | #159 | Good 4.5% |
| Immigrants | Senegal | 68.0 /100 | #160 | Good 4.5% |
| Assyrians/Chaldeans/Syriacs | 67.4 /100 | #161 | Good 4.5% |
| Peruvians | 65.2 /100 | #162 | Good 4.5% |
| Sierra Leoneans | 64.3 /100 | #163 | Good 4.5% |
| Swiss | 61.0 /100 | #164 | Good 4.5% |
| Costa Ricans | 59.9 /100 | #165 | Average 4.5% |
| Immigrants | Colombia | 59.4 /100 | #166 | Average 4.5% |
| Immigrants | Afghanistan | 59.2 /100 | #167 | Average 4.5% |
| Immigrants | Sierra Leone | 58.7 /100 | #168 | Average 4.5% |
| Chinese | 58.6 /100 | #169 | Average 4.5% |
| Immigrants | Zaire | 57.4 /100 | #170 | Average 4.5% |