Spanish American Indian vs Lithuanian Bachelor's Degree
COMPARE
Spanish American Indian
Lithuanian
Bachelor's Degree
Bachelor's Degree Comparison
Spanish American Indians
Lithuanians
27.5%
BACHELOR'S DEGREE
0.0/ 100
METRIC RATING
330th/ 347
METRIC RANK
42.2%
BACHELOR'S DEGREE
99.2/ 100
METRIC RATING
85th/ 347
METRIC RANK
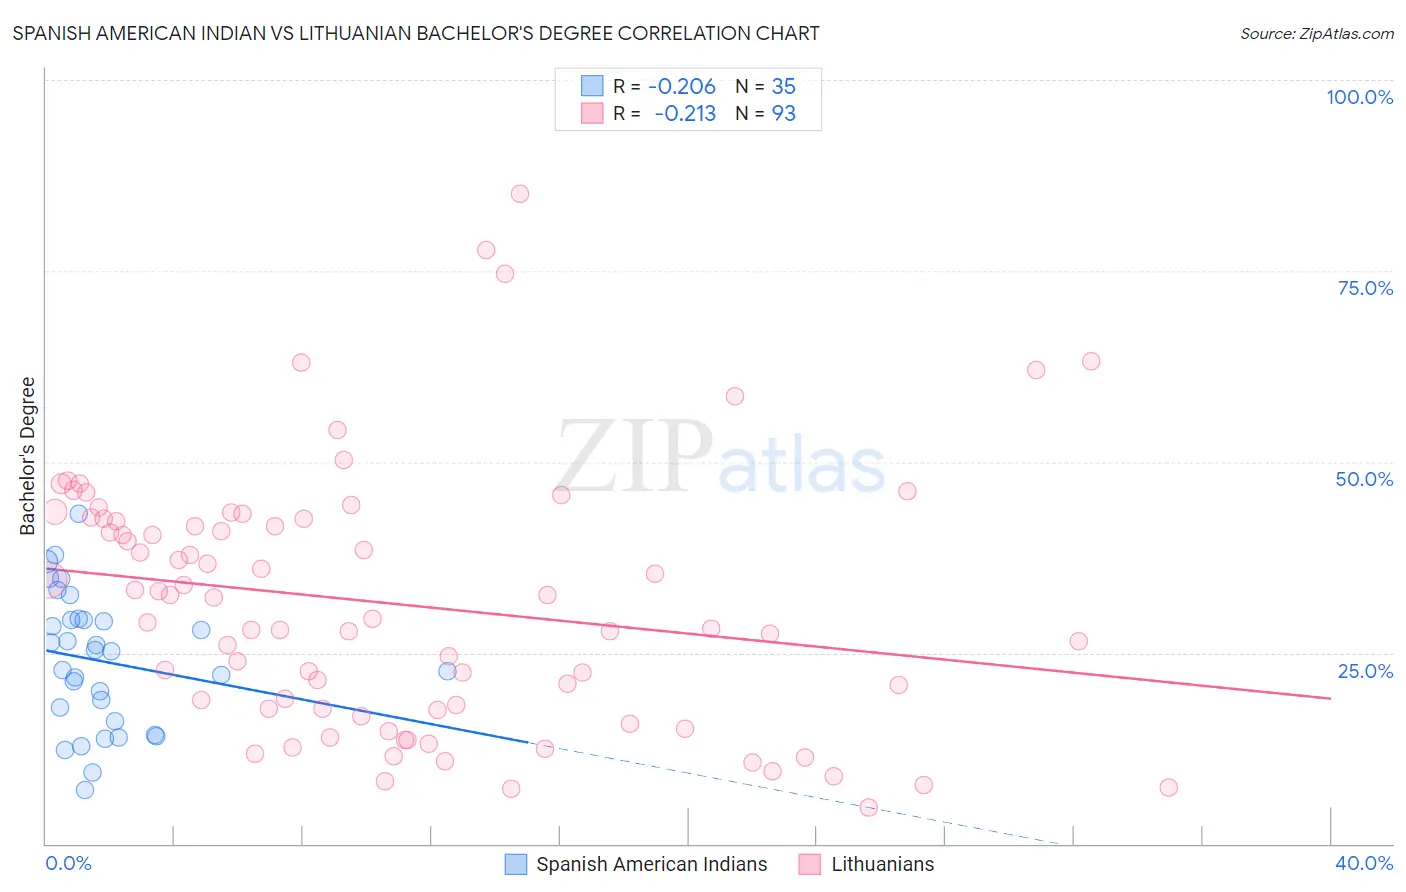
Spanish American Indian vs Lithuanian Bachelor's Degree Correlation Chart
The statistical analysis conducted on geographies consisting of 73,150,359 people shows a weak negative correlation between the proportion of Spanish American Indians and percentage of population with at least bachelor's degree education in the United States with a correlation coefficient (R) of -0.206 and weighted average of 27.5%. Similarly, the statistical analysis conducted on geographies consisting of 421,915,203 people shows a weak negative correlation between the proportion of Lithuanians and percentage of population with at least bachelor's degree education in the United States with a correlation coefficient (R) of -0.213 and weighted average of 42.2%, a difference of 53.9%.
Bachelor's Degree Correlation Summary
| Measurement | Spanish American Indian | Lithuanian |
| Minimum | 7.0% | 4.7% |
| Maximum | 43.2% | 85.2% |
| Range | 36.2% | 80.5% |
| Mean | 23.9% | 31.4% |
| Median | 25.2% | 29.4% |
| Interquartile 25% (IQ1) | 16.1% | 17.6% |
| Interquartile 75% (IQ3) | 29.3% | 42.5% |
| Interquartile Range (IQR) | 13.3% | 25.0% |
| Standard Deviation (Sample) | 8.8% | 16.9% |
| Standard Deviation (Population) | 8.7% | 16.8% |
Similar Demographics by Bachelor's Degree
Demographics Similar to Spanish American Indians by Bachelor's Degree
In terms of bachelor's degree, the demographic groups most similar to Spanish American Indians are Immigrants from Central America (27.5%, a difference of 0.060%), Immigrants from the Azores (27.3%, a difference of 0.48%), Menominee (27.3%, a difference of 0.58%), Crow (27.7%, a difference of 1.1%), and Mexican (27.1%, a difference of 1.4%).
| Demographics | Rating | Rank | Bachelor's Degree |
| Fijians | 0.0 /100 | #323 | Tragic 28.7% |
| Dutch West Indians | 0.0 /100 | #324 | Tragic 28.5% |
| Pennsylvania Germans | 0.0 /100 | #325 | Tragic 28.4% |
| Apache | 0.0 /100 | #326 | Tragic 28.3% |
| Paiute | 0.0 /100 | #327 | Tragic 28.1% |
| Crow | 0.0 /100 | #328 | Tragic 27.7% |
| Immigrants | Central America | 0.0 /100 | #329 | Tragic 27.5% |
| Spanish American Indians | 0.0 /100 | #330 | Tragic 27.5% |
| Immigrants | Azores | 0.0 /100 | #331 | Tragic 27.3% |
| Menominee | 0.0 /100 | #332 | Tragic 27.3% |
| Mexicans | 0.0 /100 | #333 | Tragic 27.1% |
| Arapaho | 0.0 /100 | #334 | Tragic 26.6% |
| Natives/Alaskans | 0.0 /100 | #335 | Tragic 26.3% |
| Immigrants | Mexico | 0.0 /100 | #336 | Tragic 26.1% |
| Inupiat | 0.0 /100 | #337 | Tragic 25.8% |
Demographics Similar to Lithuanians by Bachelor's Degree
In terms of bachelor's degree, the demographic groups most similar to Lithuanians are Immigrants from Western Asia (42.3%, a difference of 0.030%), Armenian (42.3%, a difference of 0.040%), Immigrants from Scotland (42.3%, a difference of 0.070%), Immigrants from Brazil (42.2%, a difference of 0.080%), and Immigrants from Hungary (42.3%, a difference of 0.14%).
| Demographics | Rating | Rank | Bachelor's Degree |
| Immigrants | Ethiopia | 99.4 /100 | #78 | Exceptional 42.5% |
| Immigrants | Lebanon | 99.3 /100 | #79 | Exceptional 42.4% |
| Immigrants | Croatia | 99.2 /100 | #80 | Exceptional 42.3% |
| Immigrants | Hungary | 99.2 /100 | #81 | Exceptional 42.3% |
| Immigrants | Scotland | 99.2 /100 | #82 | Exceptional 42.3% |
| Armenians | 99.2 /100 | #83 | Exceptional 42.3% |
| Immigrants | Western Asia | 99.2 /100 | #84 | Exceptional 42.3% |
| Lithuanians | 99.2 /100 | #85 | Exceptional 42.2% |
| Immigrants | Brazil | 99.2 /100 | #86 | Exceptional 42.2% |
| Carpatho Rusyns | 99.0 /100 | #87 | Exceptional 42.1% |
| Immigrants | Western Europe | 99.0 /100 | #88 | Exceptional 42.0% |
| Greeks | 99.0 /100 | #89 | Exceptional 42.0% |
| Laotians | 98.9 /100 | #90 | Exceptional 42.0% |
| Immigrants | Northern Africa | 98.9 /100 | #91 | Exceptional 41.9% |
| Maltese | 98.8 /100 | #92 | Exceptional 41.9% |