Salvadoran vs Syrian 10th Grade
COMPARE
Salvadoran
Syrian
10th Grade
10th Grade Comparison
Salvadorans
Syrians
87.5%
10TH GRADE
0.0/ 100
METRIC RATING
341st/ 347
METRIC RANK
94.5%
10TH GRADE
97.7/ 100
METRIC RATING
101st/ 347
METRIC RANK
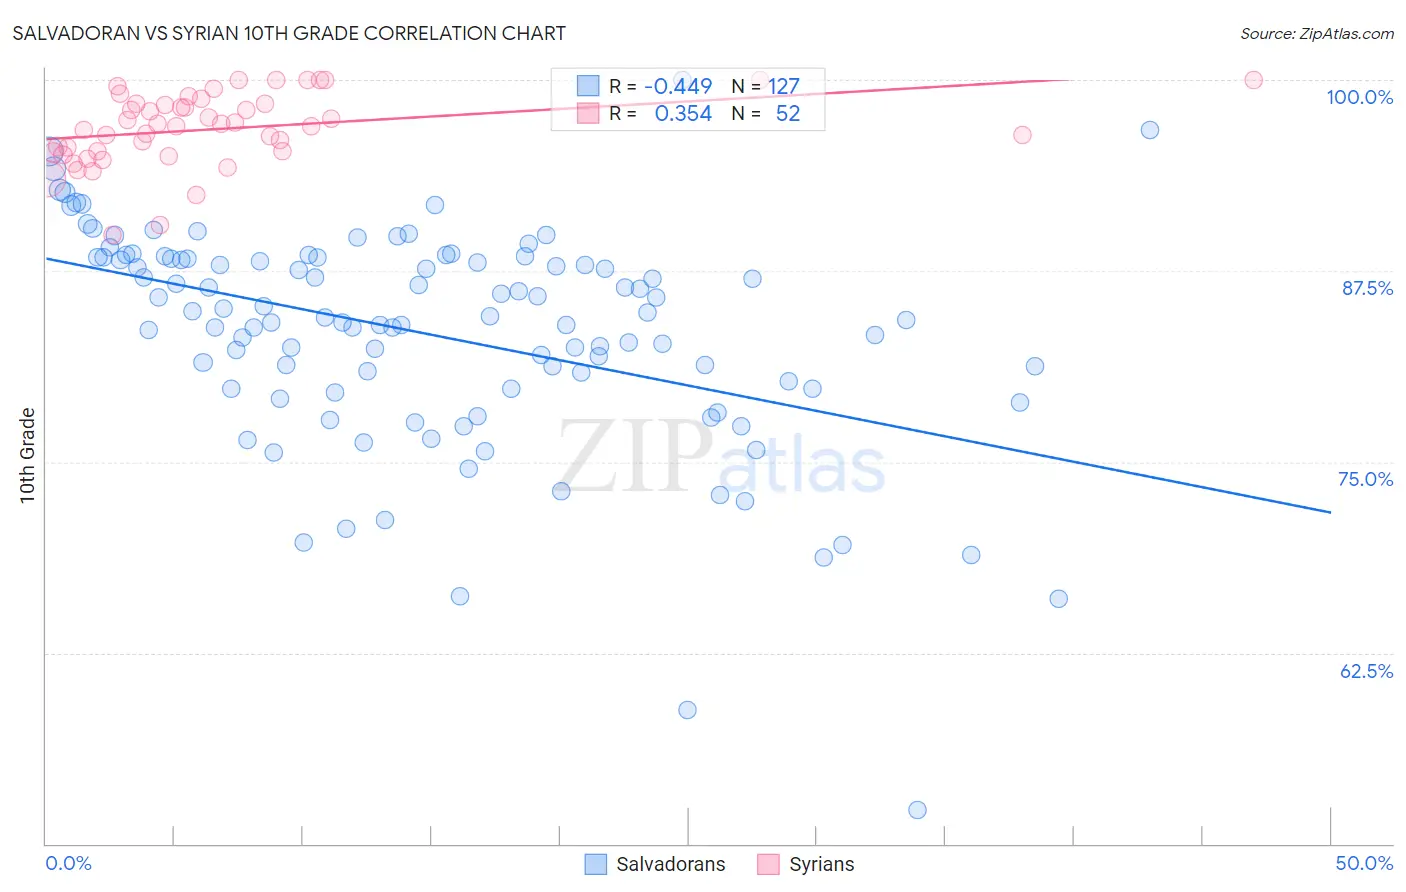
Salvadoran vs Syrian 10th Grade Correlation Chart
The statistical analysis conducted on geographies consisting of 399,034,410 people shows a moderate negative correlation between the proportion of Salvadorans and percentage of population with at least 10th grade education in the United States with a correlation coefficient (R) of -0.449 and weighted average of 87.5%. Similarly, the statistical analysis conducted on geographies consisting of 266,305,988 people shows a mild positive correlation between the proportion of Syrians and percentage of population with at least 10th grade education in the United States with a correlation coefficient (R) of 0.354 and weighted average of 94.5%, a difference of 8.0%.
10th Grade Correlation Summary
| Measurement | Salvadoran | Syrian |
| Minimum | 52.2% | 89.8% |
| Maximum | 100.0% | 100.0% |
| Range | 47.8% | 10.2% |
| Mean | 83.4% | 96.8% |
| Median | 84.5% | 97.1% |
| Interquartile 25% (IQ1) | 79.8% | 95.3% |
| Interquartile 75% (IQ3) | 88.3% | 98.4% |
| Interquartile Range (IQR) | 8.5% | 3.2% |
| Standard Deviation (Sample) | 7.3% | 2.4% |
| Standard Deviation (Population) | 7.3% | 2.3% |
Similar Demographics by 10th Grade
Demographics Similar to Salvadorans by 10th Grade
In terms of 10th grade, the demographic groups most similar to Salvadorans are Immigrants from Guatemala (87.4%, a difference of 0.16%), Mexican (87.8%, a difference of 0.29%), Guatemalan (87.9%, a difference of 0.44%), Yakama (86.9%, a difference of 0.74%), and Immigrants from El Salvador (86.8%, a difference of 0.88%).
| Demographics | Rating | Rank | 10th Grade |
| Hondurans | 0.0 /100 | #333 | Tragic 89.0% |
| Hispanics or Latinos | 0.0 /100 | #334 | Tragic 88.9% |
| Immigrants | Dominican Republic | 0.0 /100 | #335 | Tragic 88.7% |
| Immigrants | Honduras | 0.0 /100 | #336 | Tragic 88.5% |
| Central Americans | 0.0 /100 | #337 | Tragic 88.4% |
| Immigrants | Latin America | 0.0 /100 | #338 | Tragic 88.3% |
| Guatemalans | 0.0 /100 | #339 | Tragic 87.9% |
| Mexicans | 0.0 /100 | #340 | Tragic 87.8% |
| Salvadorans | 0.0 /100 | #341 | Tragic 87.5% |
| Immigrants | Guatemala | 0.0 /100 | #342 | Tragic 87.4% |
| Yakama | 0.0 /100 | #343 | Tragic 86.9% |
| Immigrants | El Salvador | 0.0 /100 | #344 | Tragic 86.8% |
| Immigrants | Central America | 0.0 /100 | #345 | Tragic 86.6% |
| Spanish American Indians | 0.0 /100 | #346 | Tragic 86.2% |
| Immigrants | Mexico | 0.0 /100 | #347 | Tragic 86.2% |
Demographics Similar to Syrians by 10th Grade
In terms of 10th grade, the demographic groups most similar to Syrians are Immigrants from South Central Asia (94.5%, a difference of 0.0%), Cambodian (94.5%, a difference of 0.010%), Immigrants from France (94.5%, a difference of 0.020%), Immigrants from Europe (94.5%, a difference of 0.020%), and Immigrants from Romania (94.5%, a difference of 0.020%).
| Demographics | Rating | Rank | 10th Grade |
| Immigrants | Germany | 98.3 /100 | #94 | Exceptional 94.6% |
| Menominee | 98.3 /100 | #95 | Exceptional 94.6% |
| Immigrants | Switzerland | 98.3 /100 | #96 | Exceptional 94.6% |
| Lebanese | 98.3 /100 | #97 | Exceptional 94.6% |
| Immigrants | Bulgaria | 98.1 /100 | #98 | Exceptional 94.6% |
| Immigrants | France | 97.9 /100 | #99 | Exceptional 94.5% |
| Immigrants | South Central Asia | 97.8 /100 | #100 | Exceptional 94.5% |
| Syrians | 97.7 /100 | #101 | Exceptional 94.5% |
| Cambodians | 97.6 /100 | #102 | Exceptional 94.5% |
| Immigrants | Europe | 97.5 /100 | #103 | Exceptional 94.5% |
| Immigrants | Romania | 97.5 /100 | #104 | Exceptional 94.5% |
| Immigrants | Turkey | 97.4 /100 | #105 | Exceptional 94.5% |
| Immigrants | Serbia | 97.4 /100 | #106 | Exceptional 94.5% |
| Immigrants | Croatia | 97.4 /100 | #107 | Exceptional 94.5% |
| Immigrants | North Macedonia | 97.2 /100 | #108 | Exceptional 94.5% |