Eastern European vs Indian (Asian) 10th Grade
COMPARE
Eastern European
Indian (Asian)
10th Grade
10th Grade Comparison
Eastern Europeans
Indians (Asian)
95.5%
10TH GRADE
100.0/ 100
METRIC RATING
22nd/ 347
METRIC RANK
93.4%
10TH GRADE
17.6/ 100
METRIC RATING
210th/ 347
METRIC RANK
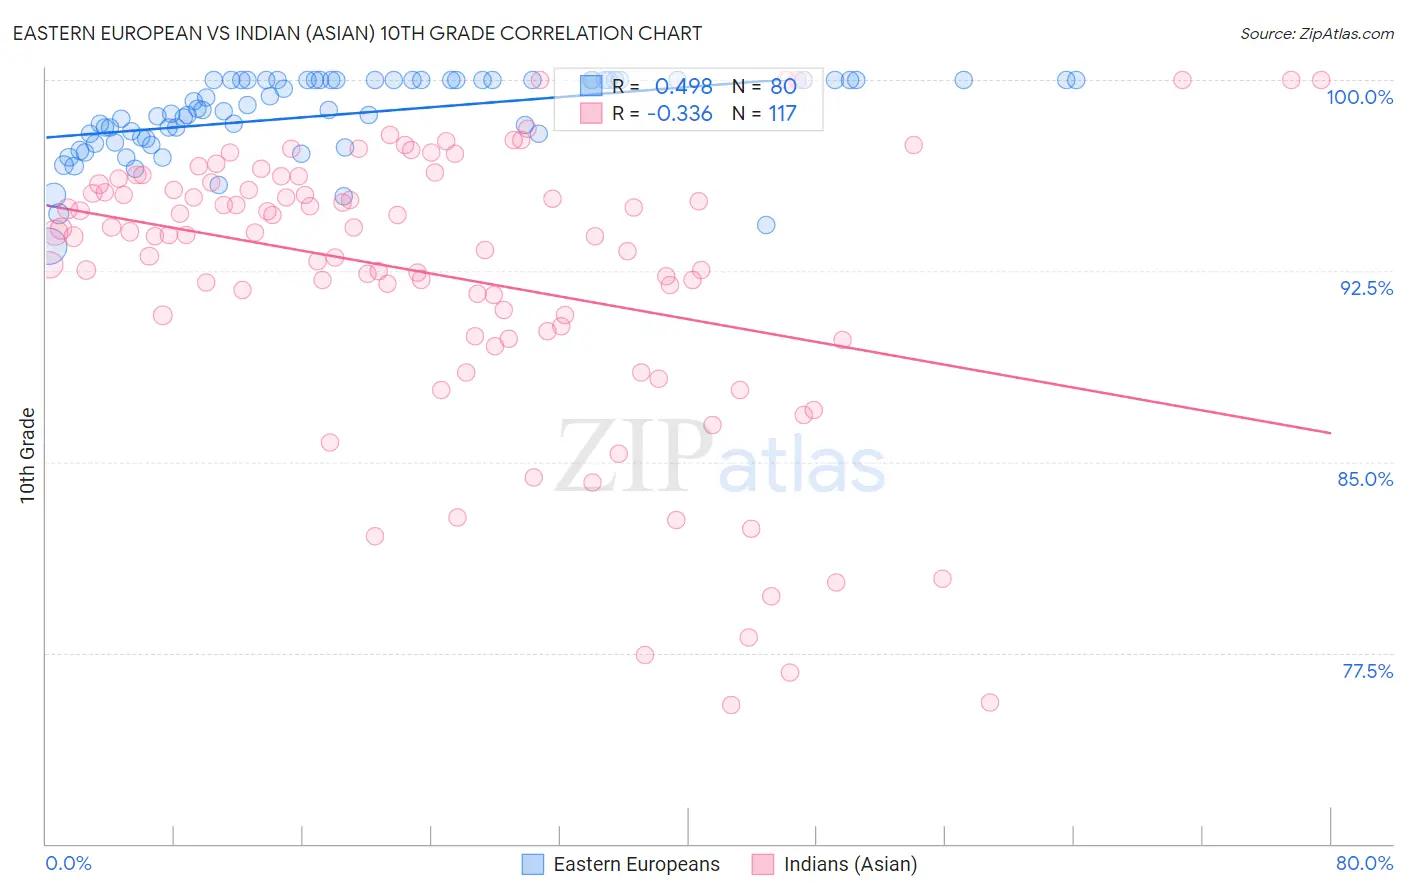
Eastern European vs Indian (Asian) 10th Grade Correlation Chart
The statistical analysis conducted on geographies consisting of 461,247,419 people shows a moderate positive correlation between the proportion of Eastern Europeans and percentage of population with at least 10th grade education in the United States with a correlation coefficient (R) of 0.498 and weighted average of 95.5%. Similarly, the statistical analysis conducted on geographies consisting of 495,348,182 people shows a mild negative correlation between the proportion of Indians (Asian) and percentage of population with at least 10th grade education in the United States with a correlation coefficient (R) of -0.336 and weighted average of 93.4%, a difference of 2.2%.
10th Grade Correlation Summary
| Measurement | Eastern European | Indian (Asian) |
| Minimum | 93.5% | 75.5% |
| Maximum | 100.0% | 100.0% |
| Range | 6.5% | 24.5% |
| Mean | 98.6% | 92.3% |
| Median | 98.9% | 93.9% |
| Interquartile 25% (IQ1) | 97.7% | 90.2% |
| Interquartile 75% (IQ3) | 100.0% | 95.9% |
| Interquartile Range (IQR) | 2.3% | 5.7% |
| Standard Deviation (Sample) | 1.6% | 5.6% |
| Standard Deviation (Population) | 1.5% | 5.5% |
Similar Demographics by 10th Grade
Demographics Similar to Eastern Europeans by 10th Grade
In terms of 10th grade, the demographic groups most similar to Eastern Europeans are Czech (95.5%, a difference of 0.010%), European (95.5%, a difference of 0.020%), Maltese (95.5%, a difference of 0.030%), Dutch (95.5%, a difference of 0.040%), and Welsh (95.5%, a difference of 0.040%).
| Demographics | Rating | Rank | 10th Grade |
| Irish | 100.0 /100 | #15 | Exceptional 95.6% |
| Scottish | 100.0 /100 | #16 | Exceptional 95.6% |
| Latvians | 100.0 /100 | #17 | Exceptional 95.6% |
| Italians | 100.0 /100 | #18 | Exceptional 95.6% |
| Scandinavians | 100.0 /100 | #19 | Exceptional 95.6% |
| Chinese | 100.0 /100 | #20 | Exceptional 95.5% |
| Dutch | 100.0 /100 | #21 | Exceptional 95.5% |
| Eastern Europeans | 100.0 /100 | #22 | Exceptional 95.5% |
| Czechs | 100.0 /100 | #23 | Exceptional 95.5% |
| Europeans | 100.0 /100 | #24 | Exceptional 95.5% |
| Maltese | 100.0 /100 | #25 | Exceptional 95.5% |
| Welsh | 100.0 /100 | #26 | Exceptional 95.5% |
| Alaskan Athabascans | 100.0 /100 | #27 | Exceptional 95.4% |
| Luxembourgers | 100.0 /100 | #28 | Exceptional 95.4% |
| Bulgarians | 100.0 /100 | #29 | Exceptional 95.4% |
Demographics Similar to Indians (Asian) by 10th Grade
In terms of 10th grade, the demographic groups most similar to Indians (Asian) are Cajun (93.4%, a difference of 0.010%), Immigrants from Zaire (93.4%, a difference of 0.010%), Immigrants from Chile (93.4%, a difference of 0.020%), Samoan (93.4%, a difference of 0.030%), and Immigrants from Syria (93.4%, a difference of 0.030%).
| Demographics | Rating | Rank | 10th Grade |
| Immigrants | Western Asia | 20.6 /100 | #203 | Fair 93.4% |
| Ute | 20.3 /100 | #204 | Fair 93.4% |
| Immigrants | Indonesia | 20.2 /100 | #205 | Fair 93.4% |
| Immigrants | Sudan | 20.0 /100 | #206 | Fair 93.4% |
| Samoans | 19.5 /100 | #207 | Poor 93.4% |
| Immigrants | Syria | 19.4 /100 | #208 | Poor 93.4% |
| Immigrants | Chile | 18.8 /100 | #209 | Poor 93.4% |
| Indians (Asian) | 17.6 /100 | #210 | Poor 93.4% |
| Cajuns | 16.9 /100 | #211 | Poor 93.4% |
| Immigrants | Zaire | 16.7 /100 | #212 | Poor 93.4% |
| Immigrants | Asia | 15.7 /100 | #213 | Poor 93.4% |
| Immigrants | Bahamas | 15.2 /100 | #214 | Poor 93.4% |
| Immigrants | Oceania | 15.1 /100 | #215 | Poor 93.4% |
| Immigrants | Eastern Africa | 14.7 /100 | #216 | Poor 93.4% |
| Portuguese | 12.1 /100 | #217 | Poor 93.3% |