Immigrants from Lithuania vs Indian (Asian) 10th Grade
COMPARE
Immigrants from Lithuania
Indian (Asian)
10th Grade
10th Grade Comparison
Immigrants from Lithuania
Indians (Asian)
95.0%
10TH GRADE
99.8/ 100
METRIC RATING
54th/ 347
METRIC RANK
93.4%
10TH GRADE
17.6/ 100
METRIC RATING
210th/ 347
METRIC RANK
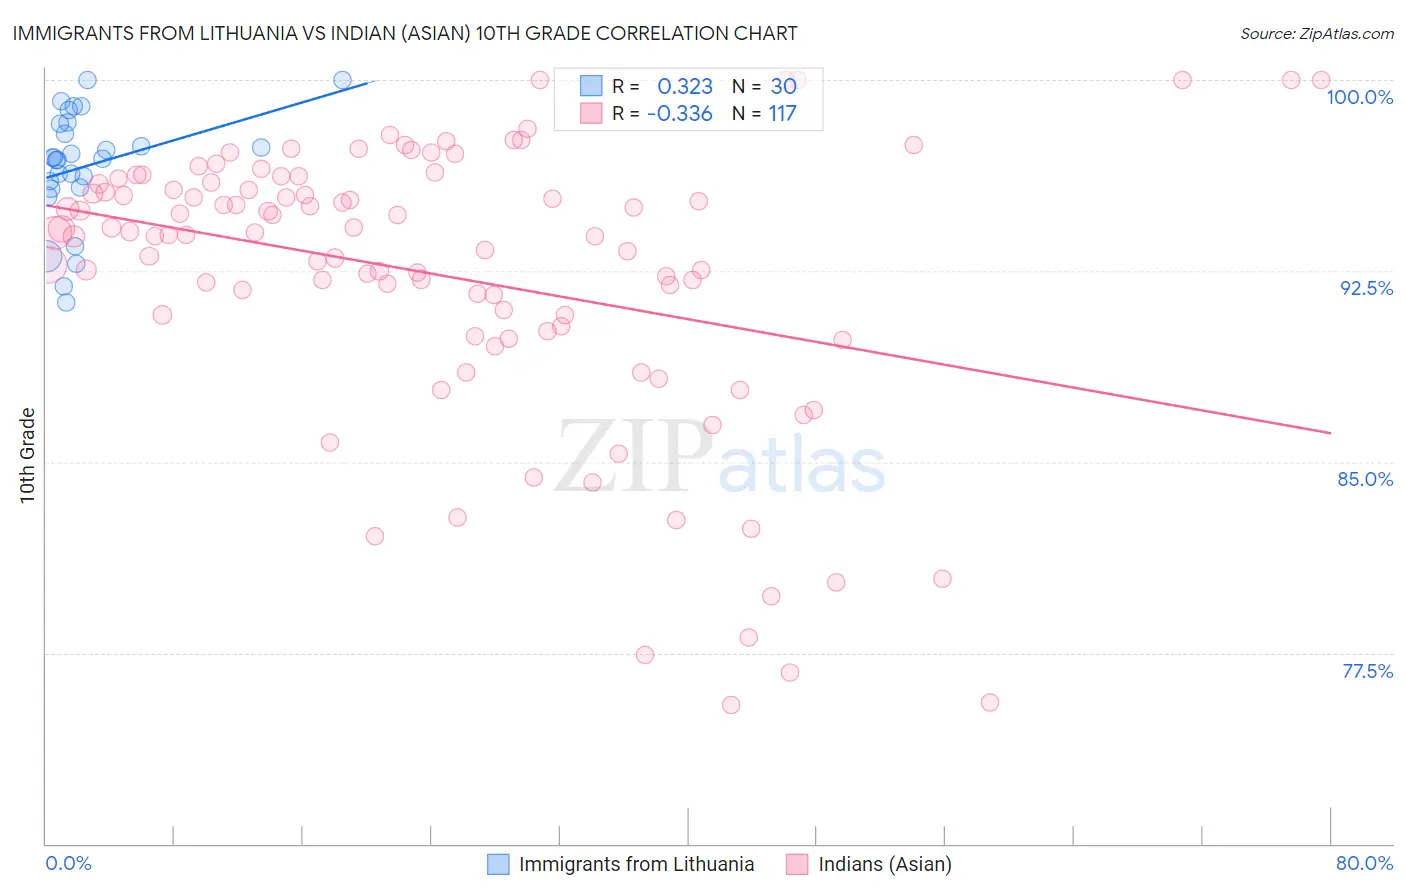
Immigrants from Lithuania vs Indian (Asian) 10th Grade Correlation Chart
The statistical analysis conducted on geographies consisting of 117,724,932 people shows a mild positive correlation between the proportion of Immigrants from Lithuania and percentage of population with at least 10th grade education in the United States with a correlation coefficient (R) of 0.323 and weighted average of 95.0%. Similarly, the statistical analysis conducted on geographies consisting of 495,348,182 people shows a mild negative correlation between the proportion of Indians (Asian) and percentage of population with at least 10th grade education in the United States with a correlation coefficient (R) of -0.336 and weighted average of 93.4%, a difference of 1.7%.
10th Grade Correlation Summary
| Measurement | Immigrants from Lithuania | Indian (Asian) |
| Minimum | 91.3% | 75.5% |
| Maximum | 100.0% | 100.0% |
| Range | 8.7% | 24.5% |
| Mean | 96.6% | 92.3% |
| Median | 96.9% | 93.9% |
| Interquartile 25% (IQ1) | 95.8% | 90.2% |
| Interquartile 75% (IQ3) | 98.3% | 95.9% |
| Interquartile Range (IQR) | 2.5% | 5.7% |
| Standard Deviation (Sample) | 2.2% | 5.6% |
| Standard Deviation (Population) | 2.2% | 5.5% |
Similar Demographics by 10th Grade
Demographics Similar to Immigrants from Lithuania by 10th Grade
In terms of 10th grade, the demographic groups most similar to Immigrants from Lithuania are Immigrants from Ireland (95.0%, a difference of 0.010%), Immigrants from North America (95.0%, a difference of 0.020%), New Zealander (95.0%, a difference of 0.020%), Ukrainian (95.0%, a difference of 0.020%), and Aleut (95.0%, a difference of 0.020%).
| Demographics | Rating | Rank | 10th Grade |
| Serbians | 99.9 /100 | #47 | Exceptional 95.1% |
| Australians | 99.9 /100 | #48 | Exceptional 95.1% |
| Immigrants | Austria | 99.9 /100 | #49 | Exceptional 95.1% |
| Immigrants | Canada | 99.8 /100 | #50 | Exceptional 95.1% |
| Austrians | 99.8 /100 | #51 | Exceptional 95.1% |
| Ottawa | 99.8 /100 | #52 | Exceptional 95.1% |
| Immigrants | North America | 99.8 /100 | #53 | Exceptional 95.0% |
| Immigrants | Lithuania | 99.8 /100 | #54 | Exceptional 95.0% |
| Immigrants | Ireland | 99.8 /100 | #55 | Exceptional 95.0% |
| New Zealanders | 99.8 /100 | #56 | Exceptional 95.0% |
| Ukrainians | 99.8 /100 | #57 | Exceptional 95.0% |
| Aleuts | 99.8 /100 | #58 | Exceptional 95.0% |
| Celtics | 99.8 /100 | #59 | Exceptional 95.0% |
| Cypriots | 99.8 /100 | #60 | Exceptional 95.0% |
| Chippewa | 99.8 /100 | #61 | Exceptional 95.0% |
Demographics Similar to Indians (Asian) by 10th Grade
In terms of 10th grade, the demographic groups most similar to Indians (Asian) are Cajun (93.4%, a difference of 0.010%), Immigrants from Zaire (93.4%, a difference of 0.010%), Immigrants from Chile (93.4%, a difference of 0.020%), Samoan (93.4%, a difference of 0.030%), and Immigrants from Syria (93.4%, a difference of 0.030%).
| Demographics | Rating | Rank | 10th Grade |
| Immigrants | Western Asia | 20.6 /100 | #203 | Fair 93.4% |
| Ute | 20.3 /100 | #204 | Fair 93.4% |
| Immigrants | Indonesia | 20.2 /100 | #205 | Fair 93.4% |
| Immigrants | Sudan | 20.0 /100 | #206 | Fair 93.4% |
| Samoans | 19.5 /100 | #207 | Poor 93.4% |
| Immigrants | Syria | 19.4 /100 | #208 | Poor 93.4% |
| Immigrants | Chile | 18.8 /100 | #209 | Poor 93.4% |
| Indians (Asian) | 17.6 /100 | #210 | Poor 93.4% |
| Cajuns | 16.9 /100 | #211 | Poor 93.4% |
| Immigrants | Zaire | 16.7 /100 | #212 | Poor 93.4% |
| Immigrants | Asia | 15.7 /100 | #213 | Poor 93.4% |
| Immigrants | Bahamas | 15.2 /100 | #214 | Poor 93.4% |
| Immigrants | Oceania | 15.1 /100 | #215 | Poor 93.4% |
| Immigrants | Eastern Africa | 14.7 /100 | #216 | Poor 93.4% |
| Portuguese | 12.1 /100 | #217 | Poor 93.3% |