Spaniard vs Iroquois Associate's Degree
COMPARE
Spaniard
Iroquois
Associate's Degree
Associate's Degree Comparison
Spaniards
Iroquois
45.2%
ASSOCIATE'S DEGREE
20.4/ 100
METRIC RATING
202nd/ 347
METRIC RANK
42.8%
ASSOCIATE'S DEGREE
1.7/ 100
METRIC RATING
238th/ 347
METRIC RANK
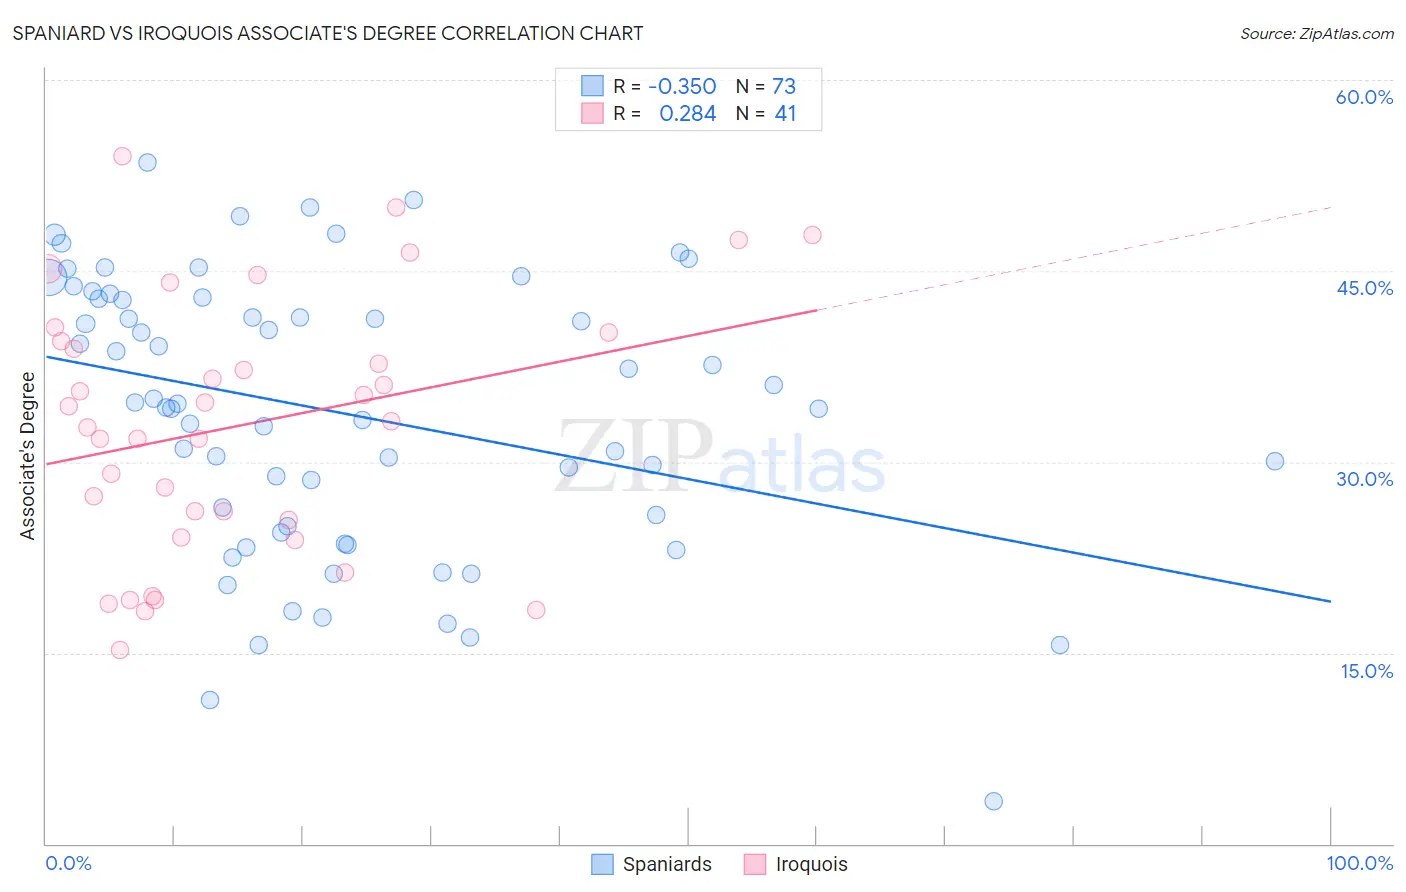
Spaniard vs Iroquois Associate's Degree Correlation Chart
The statistical analysis conducted on geographies consisting of 443,508,579 people shows a mild negative correlation between the proportion of Spaniards and percentage of population with at least associate's degree education in the United States with a correlation coefficient (R) of -0.350 and weighted average of 45.2%. Similarly, the statistical analysis conducted on geographies consisting of 207,308,228 people shows a weak positive correlation between the proportion of Iroquois and percentage of population with at least associate's degree education in the United States with a correlation coefficient (R) of 0.284 and weighted average of 42.8%, a difference of 5.5%.
Associate's Degree Correlation Summary
| Measurement | Spaniard | Iroquois |
| Minimum | 3.3% | 15.2% |
| Maximum | 53.6% | 54.0% |
| Range | 50.2% | 38.7% |
| Mean | 33.8% | 32.9% |
| Median | 34.5% | 33.2% |
| Interquartile 25% (IQ1) | 24.7% | 24.8% |
| Interquartile 75% (IQ3) | 42.8% | 39.9% |
| Interquartile Range (IQR) | 18.1% | 15.1% |
| Standard Deviation (Sample) | 10.9% | 10.1% |
| Standard Deviation (Population) | 10.8% | 9.9% |
Similar Demographics by Associate's Degree
Demographics Similar to Spaniards by Associate's Degree
In terms of associate's degree, the demographic groups most similar to Spaniards are Immigrants from South Eastern Asia (45.2%, a difference of 0.020%), Immigrants from Vietnam (45.2%, a difference of 0.050%), Senegalese (45.2%, a difference of 0.080%), Immigrants from Senegal (45.2%, a difference of 0.090%), and Immigrants from Bangladesh (45.2%, a difference of 0.11%).
| Demographics | Rating | Rank | Associate's Degree |
| Germans | 26.5 /100 | #195 | Fair 45.5% |
| French | 25.6 /100 | #196 | Fair 45.4% |
| Scotch-Irish | 22.3 /100 | #197 | Fair 45.3% |
| Immigrants | Bangladesh | 21.3 /100 | #198 | Fair 45.2% |
| Immigrants | Senegal | 21.2 /100 | #199 | Fair 45.2% |
| Senegalese | 21.1 /100 | #200 | Fair 45.2% |
| Immigrants | Vietnam | 20.8 /100 | #201 | Fair 45.2% |
| Spaniards | 20.4 /100 | #202 | Fair 45.2% |
| Immigrants | South Eastern Asia | 20.2 /100 | #203 | Fair 45.2% |
| Nigerians | 19.1 /100 | #204 | Poor 45.1% |
| Immigrants | Thailand | 18.9 /100 | #205 | Poor 45.1% |
| German Russians | 18.9 /100 | #206 | Poor 45.1% |
| Panamanians | 18.4 /100 | #207 | Poor 45.1% |
| Dutch | 17.6 /100 | #208 | Poor 45.0% |
| Immigrants | Costa Rica | 16.7 /100 | #209 | Poor 45.0% |
Demographics Similar to Iroquois by Associate's Degree
In terms of associate's degree, the demographic groups most similar to Iroquois are Nonimmigrants (42.9%, a difference of 0.26%), Immigrants from St. Vincent and the Grenadines (42.9%, a difference of 0.28%), Ecuadorian (43.0%, a difference of 0.36%), Tlingit-Haida (43.0%, a difference of 0.45%), and Immigrants from Grenada (42.6%, a difference of 0.51%).
| Demographics | Rating | Rank | Associate's Degree |
| Liberians | 2.9 /100 | #231 | Tragic 43.3% |
| Native Hawaiians | 2.3 /100 | #232 | Tragic 43.1% |
| Tongans | 2.2 /100 | #233 | Tragic 43.0% |
| Tlingit-Haida | 2.1 /100 | #234 | Tragic 43.0% |
| Ecuadorians | 2.0 /100 | #235 | Tragic 43.0% |
| Immigrants | St. Vincent and the Grenadines | 1.9 /100 | #236 | Tragic 42.9% |
| Immigrants | Nonimmigrants | 1.9 /100 | #237 | Tragic 42.9% |
| Iroquois | 1.7 /100 | #238 | Tragic 42.8% |
| Immigrants | Grenada | 1.3 /100 | #239 | Tragic 42.6% |
| Cree | 1.2 /100 | #240 | Tragic 42.5% |
| British West Indians | 1.0 /100 | #241 | Tragic 42.4% |
| Immigrants | West Indies | 1.0 /100 | #242 | Tragic 42.4% |
| Guyanese | 1.0 /100 | #243 | Tragic 42.3% |
| Immigrants | Liberia | 0.9 /100 | #244 | Tragic 42.3% |
| Immigrants | Cambodia | 0.9 /100 | #245 | Tragic 42.3% |