Paiute vs Immigrants from Africa Associate's Degree
COMPARE
Paiute
Immigrants from Africa
Associate's Degree
Associate's Degree Comparison
Paiute
Immigrants from Africa
36.4%
ASSOCIATE'S DEGREE
0.0/ 100
METRIC RATING
329th/ 347
METRIC RANK
46.8%
ASSOCIATE'S DEGREE
63.2/ 100
METRIC RATING
162nd/ 347
METRIC RANK
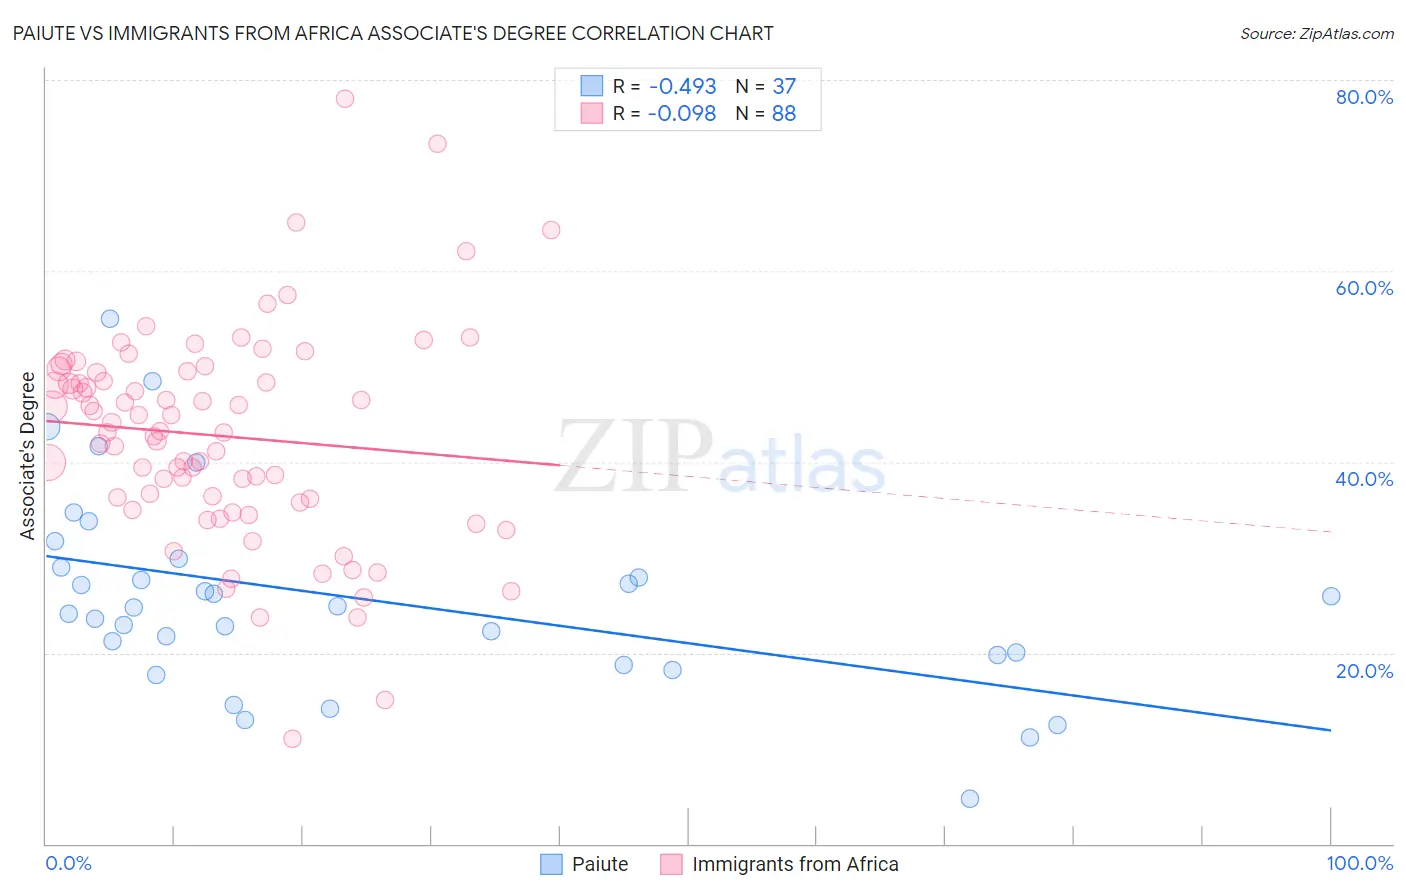
Paiute vs Immigrants from Africa Associate's Degree Correlation Chart
The statistical analysis conducted on geographies consisting of 58,403,115 people shows a moderate negative correlation between the proportion of Paiute and percentage of population with at least associate's degree education in the United States with a correlation coefficient (R) of -0.493 and weighted average of 36.4%. Similarly, the statistical analysis conducted on geographies consisting of 469,405,809 people shows a slight negative correlation between the proportion of Immigrants from Africa and percentage of population with at least associate's degree education in the United States with a correlation coefficient (R) of -0.098 and weighted average of 46.8%, a difference of 28.8%.
Associate's Degree Correlation Summary
| Measurement | Paiute | Immigrants from Africa |
| Minimum | 4.8% | 11.0% |
| Maximum | 54.9% | 78.0% |
| Range | 50.2% | 67.0% |
| Mean | 25.6% | 42.7% |
| Median | 24.7% | 43.2% |
| Interquartile 25% (IQ1) | 19.3% | 35.9% |
| Interquartile 75% (IQ3) | 29.4% | 49.4% |
| Interquartile Range (IQR) | 10.1% | 13.5% |
| Standard Deviation (Sample) | 10.4% | 11.2% |
| Standard Deviation (Population) | 10.3% | 11.2% |
Similar Demographics by Associate's Degree
Demographics Similar to Paiute by Associate's Degree
In terms of associate's degree, the demographic groups most similar to Paiute are Alaskan Athabascan (36.5%, a difference of 0.29%), Dutch West Indian (36.5%, a difference of 0.30%), Apache (36.2%, a difference of 0.31%), Kiowa (36.5%, a difference of 0.32%), and Menominee (36.7%, a difference of 0.88%).
| Demographics | Rating | Rank | Associate's Degree |
| Pennsylvania Germans | 0.0 /100 | #322 | Tragic 37.2% |
| Immigrants | Cabo Verde | 0.0 /100 | #323 | Tragic 36.8% |
| Arapaho | 0.0 /100 | #324 | Tragic 36.7% |
| Menominee | 0.0 /100 | #325 | Tragic 36.7% |
| Kiowa | 0.0 /100 | #326 | Tragic 36.5% |
| Dutch West Indians | 0.0 /100 | #327 | Tragic 36.5% |
| Alaskan Athabascans | 0.0 /100 | #328 | Tragic 36.5% |
| Paiute | 0.0 /100 | #329 | Tragic 36.4% |
| Apache | 0.0 /100 | #330 | Tragic 36.2% |
| Immigrants | Azores | 0.0 /100 | #331 | Tragic 35.6% |
| Immigrants | Central America | 0.0 /100 | #332 | Tragic 35.0% |
| Mexicans | 0.0 /100 | #333 | Tragic 35.0% |
| Natives/Alaskans | 0.0 /100 | #334 | Tragic 34.9% |
| Spanish American Indians | 0.0 /100 | #335 | Tragic 34.9% |
| Hopi | 0.0 /100 | #336 | Tragic 34.6% |
Demographics Similar to Immigrants from Africa by Associate's Degree
In terms of associate's degree, the demographic groups most similar to Immigrants from Africa are Somali (46.8%, a difference of 0.060%), Colombian (46.8%, a difference of 0.060%), Scandinavian (46.9%, a difference of 0.16%), Scottish (46.9%, a difference of 0.18%), and Immigrants from South America (46.7%, a difference of 0.26%).
| Demographics | Rating | Rank | Associate's Degree |
| Kenyans | 70.6 /100 | #155 | Good 47.1% |
| South Americans | 70.5 /100 | #156 | Good 47.1% |
| Sudanese | 70.3 /100 | #157 | Good 47.1% |
| Immigrants | Germany | 69.7 /100 | #158 | Good 47.1% |
| Immigrants | Poland | 69.2 /100 | #159 | Good 47.1% |
| Scottish | 65.4 /100 | #160 | Good 46.9% |
| Scandinavians | 65.2 /100 | #161 | Good 46.9% |
| Immigrants | Africa | 63.2 /100 | #162 | Good 46.8% |
| Somalis | 62.5 /100 | #163 | Good 46.8% |
| Colombians | 62.4 /100 | #164 | Good 46.8% |
| Immigrants | South America | 59.9 /100 | #165 | Average 46.7% |
| Hungarians | 59.3 /100 | #166 | Average 46.7% |
| Immigrants | Sierra Leone | 59.2 /100 | #167 | Average 46.7% |
| Immigrants | Somalia | 55.5 /100 | #168 | Average 46.5% |
| Uruguayans | 55.4 /100 | #169 | Average 46.5% |