Pakistani vs Immigrants from Africa Associate's Degree
COMPARE
Pakistani
Immigrants from Africa
Associate's Degree
Associate's Degree Comparison
Pakistanis
Immigrants from Africa
48.1%
ASSOCIATE'S DEGREE
88.0/ 100
METRIC RATING
136th/ 347
METRIC RANK
46.8%
ASSOCIATE'S DEGREE
63.2/ 100
METRIC RATING
162nd/ 347
METRIC RANK
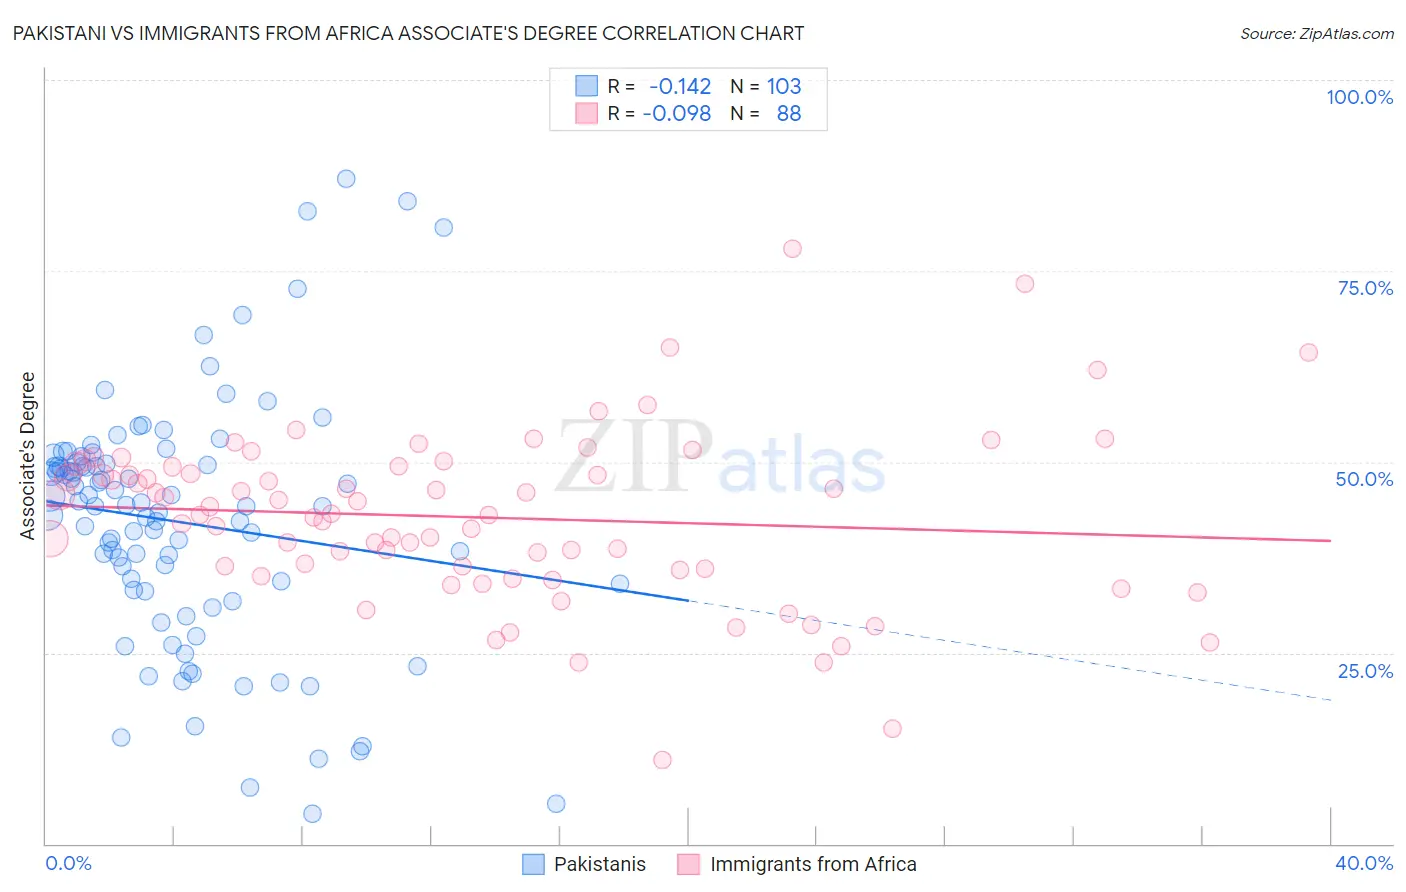
Pakistani vs Immigrants from Africa Associate's Degree Correlation Chart
The statistical analysis conducted on geographies consisting of 335,329,831 people shows a poor negative correlation between the proportion of Pakistanis and percentage of population with at least associate's degree education in the United States with a correlation coefficient (R) of -0.142 and weighted average of 48.1%. Similarly, the statistical analysis conducted on geographies consisting of 469,405,809 people shows a slight negative correlation between the proportion of Immigrants from Africa and percentage of population with at least associate's degree education in the United States with a correlation coefficient (R) of -0.098 and weighted average of 46.8%, a difference of 2.7%.
Associate's Degree Correlation Summary
| Measurement | Pakistani | Immigrants from Africa |
| Minimum | 4.0% | 11.0% |
| Maximum | 87.1% | 78.0% |
| Range | 83.1% | 67.0% |
| Mean | 42.1% | 42.7% |
| Median | 44.2% | 43.2% |
| Interquartile 25% (IQ1) | 33.2% | 35.9% |
| Interquartile 75% (IQ3) | 49.8% | 49.4% |
| Interquartile Range (IQR) | 16.6% | 13.5% |
| Standard Deviation (Sample) | 16.2% | 11.2% |
| Standard Deviation (Population) | 16.1% | 11.2% |
Similar Demographics by Associate's Degree
Demographics Similar to Pakistanis by Associate's Degree
In terms of associate's degree, the demographic groups most similar to Pakistanis are Immigrants from Eritrea (48.1%, a difference of 0.040%), Polish (48.0%, a difference of 0.11%), European (48.2%, a difference of 0.18%), Moroccan (48.2%, a difference of 0.24%), and Assyrian/Chaldean/Syriac (48.2%, a difference of 0.26%).
| Demographics | Rating | Rank | Associate's Degree |
| Swedes | 91.5 /100 | #129 | Exceptional 48.4% |
| Immigrants | Jordan | 91.2 /100 | #130 | Exceptional 48.4% |
| Icelanders | 90.8 /100 | #131 | Exceptional 48.3% |
| Immigrants | Albania | 89.9 /100 | #132 | Excellent 48.2% |
| Assyrians/Chaldeans/Syriacs | 89.4 /100 | #133 | Excellent 48.2% |
| Moroccans | 89.3 /100 | #134 | Excellent 48.2% |
| Europeans | 89.0 /100 | #135 | Excellent 48.2% |
| Pakistanis | 88.0 /100 | #136 | Excellent 48.1% |
| Immigrants | Eritrea | 87.8 /100 | #137 | Excellent 48.1% |
| Poles | 87.3 /100 | #138 | Excellent 48.0% |
| Slovenes | 85.1 /100 | #139 | Excellent 47.9% |
| Immigrants | Southern Europe | 84.4 /100 | #140 | Excellent 47.8% |
| Taiwanese | 83.3 /100 | #141 | Excellent 47.7% |
| Sierra Leoneans | 82.9 /100 | #142 | Excellent 47.7% |
| Norwegians | 81.0 /100 | #143 | Excellent 47.6% |
Demographics Similar to Immigrants from Africa by Associate's Degree
In terms of associate's degree, the demographic groups most similar to Immigrants from Africa are Somali (46.8%, a difference of 0.060%), Colombian (46.8%, a difference of 0.060%), Scandinavian (46.9%, a difference of 0.16%), Scottish (46.9%, a difference of 0.18%), and Immigrants from South America (46.7%, a difference of 0.26%).
| Demographics | Rating | Rank | Associate's Degree |
| Kenyans | 70.6 /100 | #155 | Good 47.1% |
| South Americans | 70.5 /100 | #156 | Good 47.1% |
| Sudanese | 70.3 /100 | #157 | Good 47.1% |
| Immigrants | Germany | 69.7 /100 | #158 | Good 47.1% |
| Immigrants | Poland | 69.2 /100 | #159 | Good 47.1% |
| Scottish | 65.4 /100 | #160 | Good 46.9% |
| Scandinavians | 65.2 /100 | #161 | Good 46.9% |
| Immigrants | Africa | 63.2 /100 | #162 | Good 46.8% |
| Somalis | 62.5 /100 | #163 | Good 46.8% |
| Colombians | 62.4 /100 | #164 | Good 46.8% |
| Immigrants | South America | 59.9 /100 | #165 | Average 46.7% |
| Hungarians | 59.3 /100 | #166 | Average 46.7% |
| Immigrants | Sierra Leone | 59.2 /100 | #167 | Average 46.7% |
| Immigrants | Somalia | 55.5 /100 | #168 | Average 46.5% |
| Uruguayans | 55.4 /100 | #169 | Average 46.5% |