Samoan vs Colombian 5th Grade
COMPARE
Samoan
Colombian
5th Grade
5th Grade Comparison
Samoans
Colombians
97.1%
5TH GRADE
8.5/ 100
METRIC RATING
211th/ 347
METRIC RANK
96.9%
5TH GRADE
1.3/ 100
METRIC RATING
245th/ 347
METRIC RANK
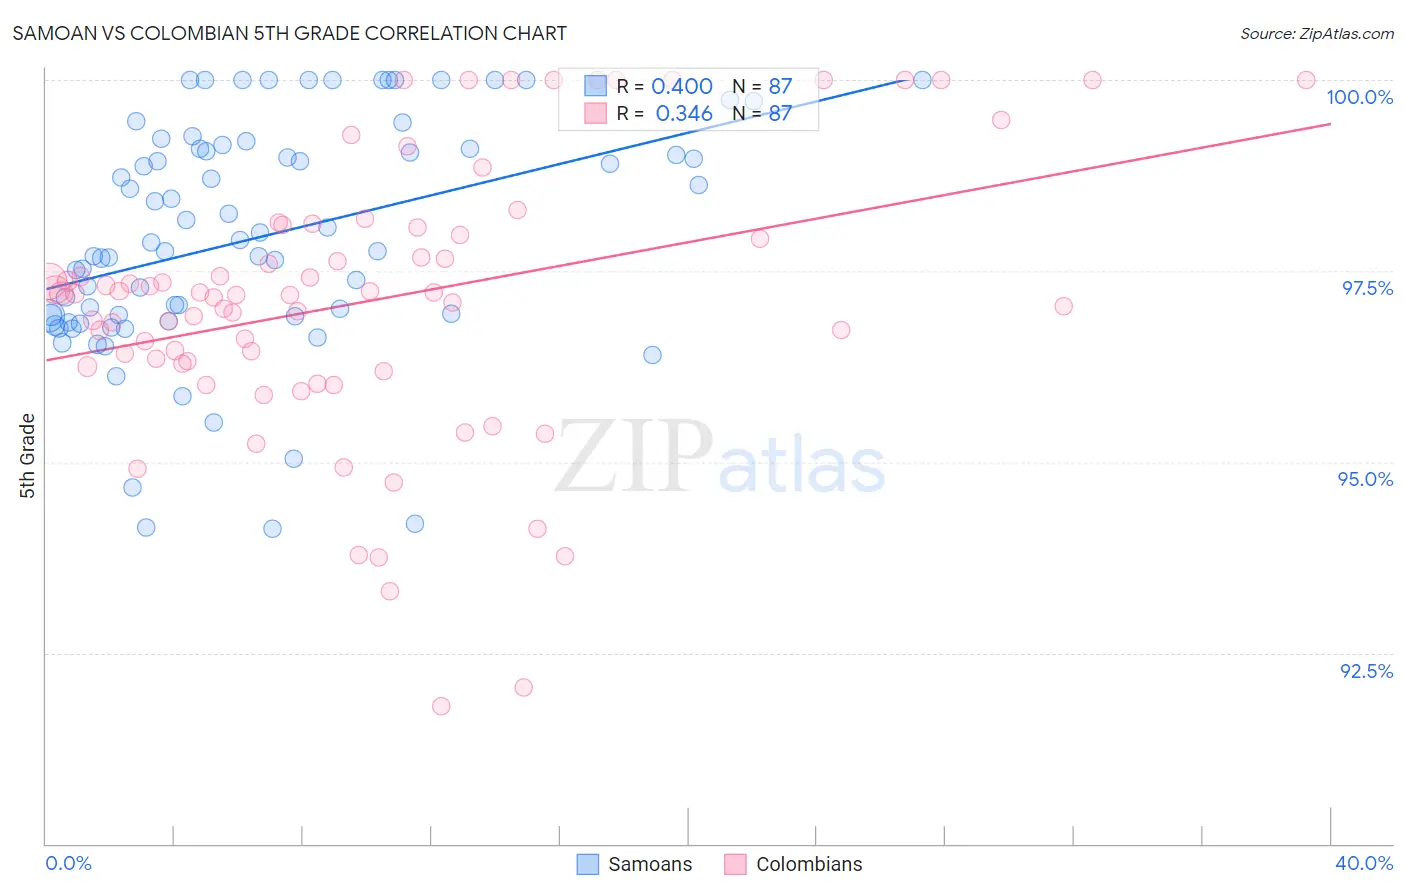
Samoan vs Colombian 5th Grade Correlation Chart
The statistical analysis conducted on geographies consisting of 225,201,909 people shows a mild positive correlation between the proportion of Samoans and percentage of population with at least 5th grade education in the United States with a correlation coefficient (R) of 0.400 and weighted average of 97.1%. Similarly, the statistical analysis conducted on geographies consisting of 419,701,178 people shows a mild positive correlation between the proportion of Colombians and percentage of population with at least 5th grade education in the United States with a correlation coefficient (R) of 0.346 and weighted average of 96.9%, a difference of 0.20%.
5th Grade Correlation Summary
| Measurement | Samoan | Colombian |
| Minimum | 94.1% | 91.8% |
| Maximum | 100.0% | 100.0% |
| Range | 5.9% | 8.2% |
| Mean | 97.9% | 97.1% |
| Median | 97.9% | 97.2% |
| Interquartile 25% (IQ1) | 96.9% | 96.3% |
| Interquartile 75% (IQ3) | 99.1% | 98.1% |
| Interquartile Range (IQR) | 2.2% | 1.8% |
| Standard Deviation (Sample) | 1.5% | 1.8% |
| Standard Deviation (Population) | 1.5% | 1.8% |
Similar Demographics by 5th Grade
Demographics Similar to Samoans by 5th Grade
In terms of 5th grade, the demographic groups most similar to Samoans are Immigrants from Iraq (97.1%, a difference of 0.0%), Portuguese (97.1%, a difference of 0.010%), Costa Rican (97.1%, a difference of 0.010%), Immigrants from Morocco (97.1%, a difference of 0.010%), and Immigrants from Nepal (97.1%, a difference of 0.020%).
| Demographics | Rating | Rank | 5th Grade |
| Immigrants | Zaire | 13.7 /100 | #204 | Poor 97.1% |
| Moroccans | 12.0 /100 | #205 | Poor 97.1% |
| Paiute | 11.6 /100 | #206 | Poor 97.1% |
| Iraqis | 10.9 /100 | #207 | Poor 97.1% |
| Laotians | 10.8 /100 | #208 | Poor 97.1% |
| Immigrants | Nepal | 10.3 /100 | #209 | Poor 97.1% |
| Immigrants | Oceania | 10.0 /100 | #210 | Poor 97.1% |
| Samoans | 8.5 /100 | #211 | Tragic 97.1% |
| Immigrants | Iraq | 8.3 /100 | #212 | Tragic 97.1% |
| Portuguese | 7.8 /100 | #213 | Tragic 97.1% |
| Costa Ricans | 7.7 /100 | #214 | Tragic 97.1% |
| Immigrants | Morocco | 7.5 /100 | #215 | Tragic 97.1% |
| Sudanese | 7.0 /100 | #216 | Tragic 97.1% |
| Immigrants | Lebanon | 6.8 /100 | #217 | Tragic 97.1% |
| Immigrants | Sudan | 6.5 /100 | #218 | Tragic 97.1% |
Demographics Similar to Colombians by 5th Grade
In terms of 5th grade, the demographic groups most similar to Colombians are Ethiopian (96.9%, a difference of 0.010%), Immigrants from Asia (96.9%, a difference of 0.020%), Immigrants from Costa Rica (96.9%, a difference of 0.020%), Immigrants from Eastern Africa (96.9%, a difference of 0.020%), and Korean (96.9%, a difference of 0.020%).
| Demographics | Rating | Rank | 5th Grade |
| Asians | 2.0 /100 | #238 | Tragic 96.9% |
| Nigerians | 1.9 /100 | #239 | Tragic 96.9% |
| Indians (Asian) | 1.9 /100 | #240 | Tragic 96.9% |
| Immigrants | Asia | 1.7 /100 | #241 | Tragic 96.9% |
| Immigrants | Costa Rica | 1.6 /100 | #242 | Tragic 96.9% |
| Immigrants | Eastern Africa | 1.6 /100 | #243 | Tragic 96.9% |
| Koreans | 1.6 /100 | #244 | Tragic 96.9% |
| Colombians | 1.3 /100 | #245 | Tragic 96.9% |
| Ethiopians | 1.2 /100 | #246 | Tragic 96.9% |
| Immigrants | Africa | 1.1 /100 | #247 | Tragic 96.9% |
| U.S. Virgin Islanders | 1.1 /100 | #248 | Tragic 96.9% |
| Immigrants | Uruguay | 1.0 /100 | #249 | Tragic 96.9% |
| Immigrants | Liberia | 1.0 /100 | #250 | Tragic 96.9% |
| Bolivians | 0.9 /100 | #251 | Tragic 96.9% |
| Jamaicans | 0.9 /100 | #252 | Tragic 96.9% |