Spaniard vs Immigrants from Cameroon 5th Grade

COMPARE

Spaniard
Race
Ancestry
AfghanAfricanAlaska NativeAlaskan AthabascanAlbanianAleutAlsatianAmericanApacheArabArapahoArgentineanArmenianAssyrian/Chaldean/SyriacAustralianAustrianBahamianBangladeshiBarbadianBasqueBelgianBelizeanBermudanBhutaneseBlackfeetBolivianBrazilianBritishBritish West IndianBulgarianBurmeseCajunCambodianCanadianCape VerdeanCarpatho RusynCelticCentral AmericanCentral American IndianCherokeeCheyenneChickasawChileanChineseChippewaChoctawColombianColvilleComancheCosta RicanCreeCreekCroatianCrowCubanCypriotCzechCzechoslovakianDanishDelawareDominicanDutchDutch West IndianEastern EuropeanEcuadorianEgyptianEnglishEstonianEthiopianEuropeanFijianFilipinoFinnishFrenchFrench American IndianFrench CanadianGermanGerman RussianGhanaianGreekGuamanian/ChamorroGuatemalanGuyaneseHaitianHmongHonduranHopiHoumaHungarianIcelanderIndian (Asian)IndonesianInupiatIranianIraqiIrishIroquoisIsraeliItalianJamaicanJapaneseJordanianKenyanKiowaKoreanLaotianLatvianLebaneseLiberianLithuanianLumbeeLuxembourgerMacedonianMalaysianMalteseMarshalleseMenomineeMexicanMexican American IndianMongolianMoroccanNative HawaiianNavajoNepaleseNew ZealanderNicaraguanNigerianNorthern EuropeanNorwegianOkinawanOsageOttawaPaiutePakistaniPalestinianPanamanianParaguayanPennsylvania GermanPeruvianPimaPolishPortuguesePotawatomiPuebloPuerto RicanPuget Sound SalishRomanianRussianSalvadoranSamoanScandinavianScotch-IrishScottishSeminoleSenegaleseSerbianShoshoneSierra LeoneanSiouxSlavicSlovakSloveneSomaliSouth AfricanSouth AmericanSouth American IndianSoviet UnionSpaniardSpanishSpanish AmericanSpanish American IndianSri LankanSubsaharan AfricanSudaneseSwedishSwissSyrianTaiwaneseThaiTlingit-HaidaTohono O'OdhamTonganTrinidadian and TobagonianTsimshianTurkishU.S. Virgin IslanderUgandanUkrainianUruguayanUteVenezuelanVietnameseWelshWest IndianYakamaYaquiYugoslavianYumanYup'ikZimbabwean
Immigration
NonimmigrantsImmigrantsAfghanistanAfricaAlbaniaArgentinaArmeniaAsiaAustraliaAustriaBahamasBangladeshBarbadosBelarusBelgiumBelizeBoliviaBosnia and HerzegovinaBrazilBulgariaBurma/MyanmarCabo VerdeCambodiaCanadaCaribbeanCentral AmericaChileChinaColombiaCongoCosta RicaCroatiaCubaCzechoslovakiaDenmarkDominicaDominican RepublicEastern AfricaEastern AsiaEastern EuropeEcuadorEgyptEl SalvadorEnglandEritreaEthiopiaEuropeFijiFranceGermanyGhanaGreeceGrenadaGuatemalaGuyanaHaitiHondurasHong KongHungaryIndiaIndonesiaIranIraqIrelandIsraelItalyJamaicaJapanJordanKazakhstanKenyaKoreaKuwaitLaosLatin AmericaLatviaLebanonLiberiaLithuaniaMalaysiaMexicoMicronesiaMiddle AfricaMoldovaMoroccoNepalNetherlandsNicaraguaNigeriaNorth AmericaNorth MacedoniaNorthern AfricaNorthern EuropeNorwayOceaniaPakistanPanamaPeruPhilippinesPolandPortugalRomaniaRussiaSaudi ArabiaScotlandSenegalSerbiaSierra LeoneSingaporeSomaliaSouth AfricaSouth AmericaSouth Central AsiaSouth Eastern AsiaSouthern EuropeSpainSri LankaSt. Vincent and the GrenadinesSudanSwedenSwitzerlandSyriaTaiwanThailandTrinidad and TobagoTurkeyUgandaUkraineUruguayUzbekistanVenezuelaVietnamWest IndiesWestern AfricaWestern AsiaWestern EuropeYemenZaireZimbabweAzores
Immigrants from Cameroon
Race
Ancestry
AfghanAfricanAlaska NativeAlaskan AthabascanAlbanianAleutAlsatianAmericanApacheArabArapahoArgentineanArmenianAssyrian/Chaldean/SyriacAustralianAustrianBahamianBangladeshiBarbadianBasqueBelgianBelizeanBermudanBhutaneseBlackfeetBolivianBrazilianBritishBritish West IndianBulgarianBurmeseCajunCambodianCanadianCape VerdeanCarpatho RusynCelticCentral AmericanCentral American IndianCherokeeCheyenneChickasawChileanChineseChippewaChoctawColombianColvilleComancheCosta RicanCreeCreekCroatianCrowCubanCypriotCzechCzechoslovakianDanishDelawareDominicanDutchDutch West IndianEastern EuropeanEcuadorianEgyptianEnglishEstonianEthiopianEuropeanFijianFilipinoFinnishFrenchFrench American IndianFrench CanadianGermanGerman RussianGhanaianGreekGuamanian/ChamorroGuatemalanGuyaneseHaitianHmongHonduranHopiHoumaHungarianIcelanderIndian (Asian)IndonesianInupiatIranianIraqiIrishIroquoisIsraeliItalianJamaicanJapaneseJordanianKenyanKiowaKoreanLaotianLatvianLebaneseLiberianLithuanianLumbeeLuxembourgerMacedonianMalaysianMalteseMarshalleseMenomineeMexicanMexican American IndianMongolianMoroccanNative HawaiianNavajoNepaleseNew ZealanderNicaraguanNigerianNorthern EuropeanNorwegianOkinawanOsageOttawaPaiutePakistaniPalestinianPanamanianParaguayanPennsylvania GermanPeruvianPimaPolishPortuguesePotawatomiPuebloPuerto RicanPuget Sound SalishRomanianRussianSalvadoranSamoanScandinavianScotch-IrishScottishSeminoleSenegaleseSerbianShoshoneSierra LeoneanSiouxSlavicSlovakSloveneSomaliSouth AfricanSouth AmericanSouth American IndianSoviet UnionSpanishSpanish AmericanSpanish American IndianSri LankanSubsaharan AfricanSudaneseSwedishSwissSyrianTaiwaneseThaiTlingit-HaidaTohono O'OdhamTonganTrinidadian and TobagonianTsimshianTurkishU.S. Virgin IslanderUgandanUkrainianUruguayanUteVenezuelanVietnameseWelshWest IndianYakamaYaquiYugoslavianYumanYup'ikZimbabwean
Immigration
NonimmigrantsImmigrantsAfghanistanAfricaAlbaniaArgentinaArmeniaAsiaAustraliaAustriaBahamasBangladeshBarbadosBelarusBelgiumBelizeBoliviaBosnia and HerzegovinaBrazilBulgariaBurma/MyanmarCabo VerdeCambodiaCameroonCanadaCaribbeanCentral AmericaChileChinaColombiaCongoCosta RicaCroatiaCubaCzechoslovakiaDenmarkDominicaDominican RepublicEastern AfricaEastern AsiaEastern EuropeEcuadorEgyptEl SalvadorEnglandEritreaEthiopiaEuropeFijiFranceGermanyGhanaGreeceGrenadaGuatemalaGuyanaHaitiHondurasHong KongHungaryIndiaIndonesiaIranIraqIrelandIsraelItalyJamaicaJapanJordanKazakhstanKenyaKoreaKuwaitLaosLatin AmericaLatviaLebanonLiberiaLithuaniaMalaysiaMexicoMicronesiaMiddle AfricaMoldovaMoroccoNepalNetherlandsNicaraguaNigeriaNorth AmericaNorth MacedoniaNorthern AfricaNorthern EuropeNorwayOceaniaPakistanPanamaPeruPhilippinesPolandPortugalRomaniaRussiaSaudi ArabiaScotlandSenegalSerbiaSierra LeoneSingaporeSomaliaSouth AfricaSouth AmericaSouth Central AsiaSouth Eastern AsiaSouthern EuropeSpainSri LankaSt. Vincent and the GrenadinesSudanSwedenSwitzerlandSyriaTaiwanThailandTrinidad and TobagoTurkeyUgandaUkraineUruguayUzbekistanVenezuelaVietnamWest IndiesWestern AfricaWestern AsiaWestern EuropeYemenZaireZimbabweAzores
5th Grade
Income
Poverty
Unemployment
Labor Participation
Family Structure
Vehicle Availability
Education Level
Disability

5th Grade Comparison

Spaniards

Immigrants from Cameroon

Excellent
Tragic
97.5%
5TH GRADE
81.9/ 100
METRIC RATING
146th/ 347
METRIC RANK
96.7%
5TH GRADE
0.1/ 100
METRIC RATING
274th/ 347
METRIC RANK

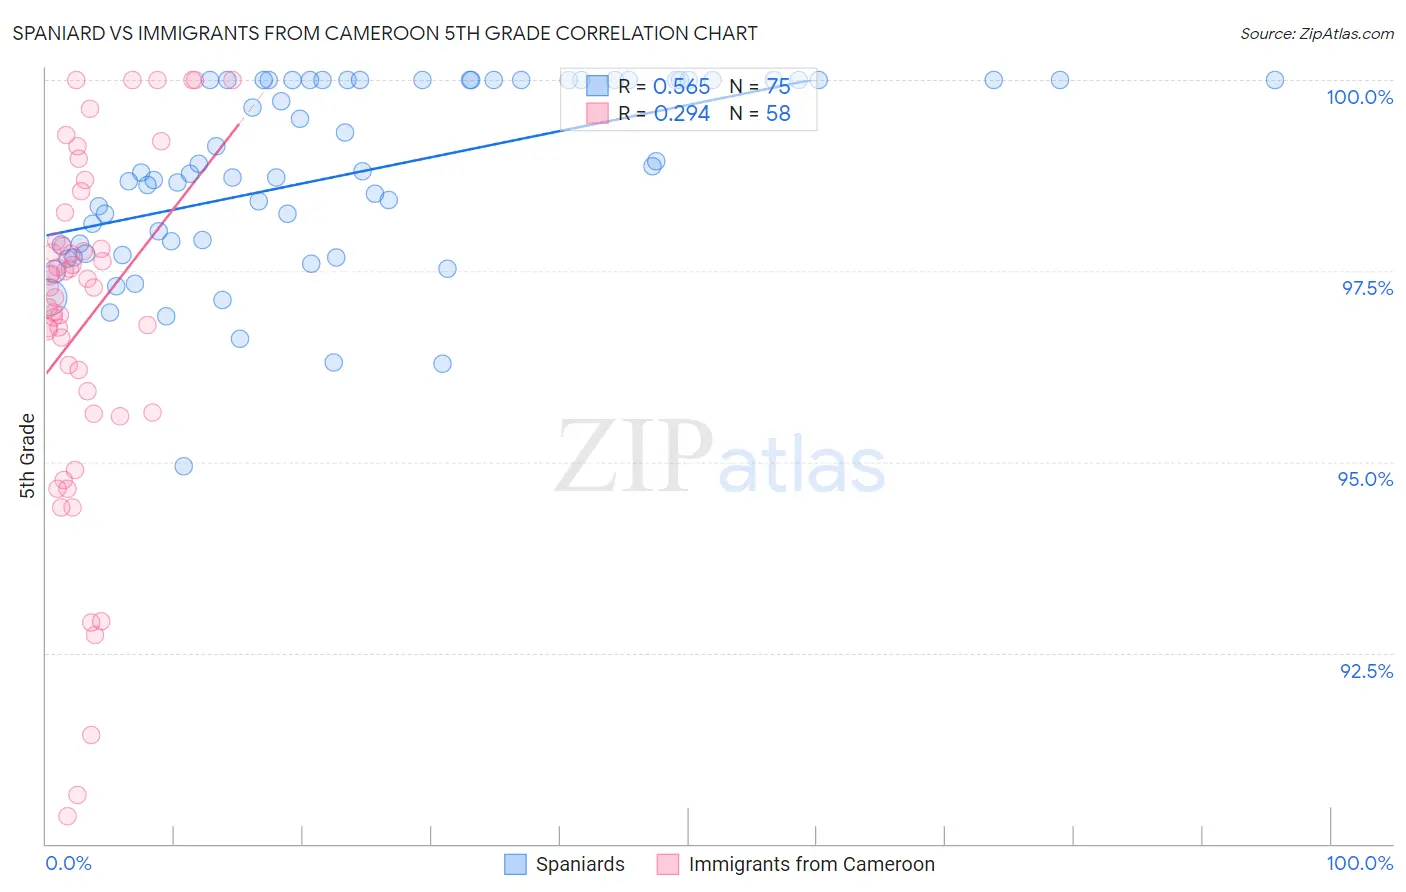
Spaniard vs Immigrants from Cameroon 5th Grade Correlation Chart

The statistical analysis conducted on geographies consisting of 443,544,503 people shows a substantial positive correlation between the proportion of Spaniards and percentage of population with at least 5th grade education in the United States with a correlation coefficient (R) of 0.565 and weighted average of 97.5%. Similarly, the statistical analysis conducted on geographies consisting of 130,752,798 people shows a weak positive correlation between the proportion of Immigrants from Cameroon and percentage of population with at least 5th grade education in the United States with a correlation coefficient (R) of 0.294 and weighted average of 96.7%, a difference of 0.85%.
Spaniard vs Immigrants from Cameroon 5th Grade

5th Grade Correlation Summary

MeasurementSpaniardImmigrants from Cameroon
Minimum94.9%90.4%
Maximum100.0%100.0%
Range5.1%9.6%
Mean98.8%96.8%
Median98.8%97.3%
Interquartile 25% (IQ1)97.8%95.7%
Interquartile 75% (IQ3)100.0%97.9%
Interquartile Range (IQR)2.2%2.2%
Standard Deviation (Sample)1.2%2.3%
Standard Deviation (Population)1.2%2.3%

Similar Demographics by 5th Grade

Demographics Similar to Spaniards by 5th Grade

In terms of 5th grade, the demographic groups most similar to Spaniards are Jordanian (97.5%, a difference of 0.0%), Immigrants from Greece (97.5%, a difference of 0.010%), Soviet Union (97.5%, a difference of 0.010%), Immigrants from Israel (97.5%, a difference of 0.020%), and Hopi (97.5%, a difference of 0.020%).
DemographicsRating | Rank5th Grade
Immigrants | Turkey
86.7
/100
|
#139
Excellent
97.5%
Burmese
86.1
/100
|
#140
Excellent
97.5%
Seminole
85.8
/100
|
#141
Excellent
97.5%
Israelis
85.5
/100
|
#142
Excellent
97.5%
Immigrants | North Macedonia
85.4
/100
|
#143
Excellent
97.5%
Immigrants | Greece
83.2
/100
|
#144
Excellent
97.5%
Jordanians
82.6
/100
|
#145
Excellent
97.5%
Spaniards
81.9
/100
|
#146
Excellent
97.5%
Soviet Union
81.2
/100
|
#147
Excellent
97.5%
Immigrants | Israel
79.1
/100
|
#148
Good
97.5%
Hopi
78.6
/100
|
#149
Good
97.5%
Immigrants | South Central Asia
78.6
/100
|
#150
Good
97.5%
Immigrants | Eastern Europe
75.0
/100
|
#151
Good
97.4%
Ute
74.9
/100
|
#152
Good
97.4%
Alsatians
74.3
/100
|
#153
Good
97.4%

Demographics Similar to Immigrants from Cameroon by 5th Grade

In terms of 5th grade, the demographic groups most similar to Immigrants from Cameroon are Yaqui (96.7%, a difference of 0.0%), Trinidadian and Tobagonian (96.7%, a difference of 0.010%), Immigrants from Peru (96.6%, a difference of 0.010%), Cuban (96.6%, a difference of 0.010%), and Immigrants from Bolivia (96.6%, a difference of 0.010%).
DemographicsRating | Rank5th Grade
Immigrants | South America
0.3
/100
|
#267
Tragic
96.7%
Armenians
0.3
/100
|
#268
Tragic
96.7%
Ghanaians
0.2
/100
|
#269
Tragic
96.7%
Afghans
0.2
/100
|
#270
Tragic
96.7%
Immigrants | Hong Kong
0.2
/100
|
#271
Tragic
96.7%
Trinidadians and Tobagonians
0.1
/100
|
#272
Tragic
96.7%
Yaqui
0.1
/100
|
#273
Tragic
96.7%
Immigrants | Cameroon
0.1
/100
|
#274
Tragic
96.7%
Immigrants | Peru
0.1
/100
|
#275
Tragic
96.6%
Cubans
0.1
/100
|
#276
Tragic
96.6%
Immigrants | Bolivia
0.1
/100
|
#277
Tragic
96.6%
Immigrants | Ghana
0.1
/100
|
#278
Tragic
96.6%
Immigrants | Philippines
0.1
/100
|
#279
Tragic
96.6%
Immigrants | Western Africa
0.1
/100
|
#280
Tragic
96.6%
Houma
0.1
/100
|
#281
Tragic
96.6%