Spaniard vs Central American 11th Grade
COMPARE
Spaniard
Central American
11th Grade
11th Grade Comparison
Spaniards
Central Americans
92.5%
11TH GRADE
46.9/ 100
METRIC RATING
176th/ 347
METRIC RANK
86.9%
11TH GRADE
0.0/ 100
METRIC RATING
335th/ 347
METRIC RANK
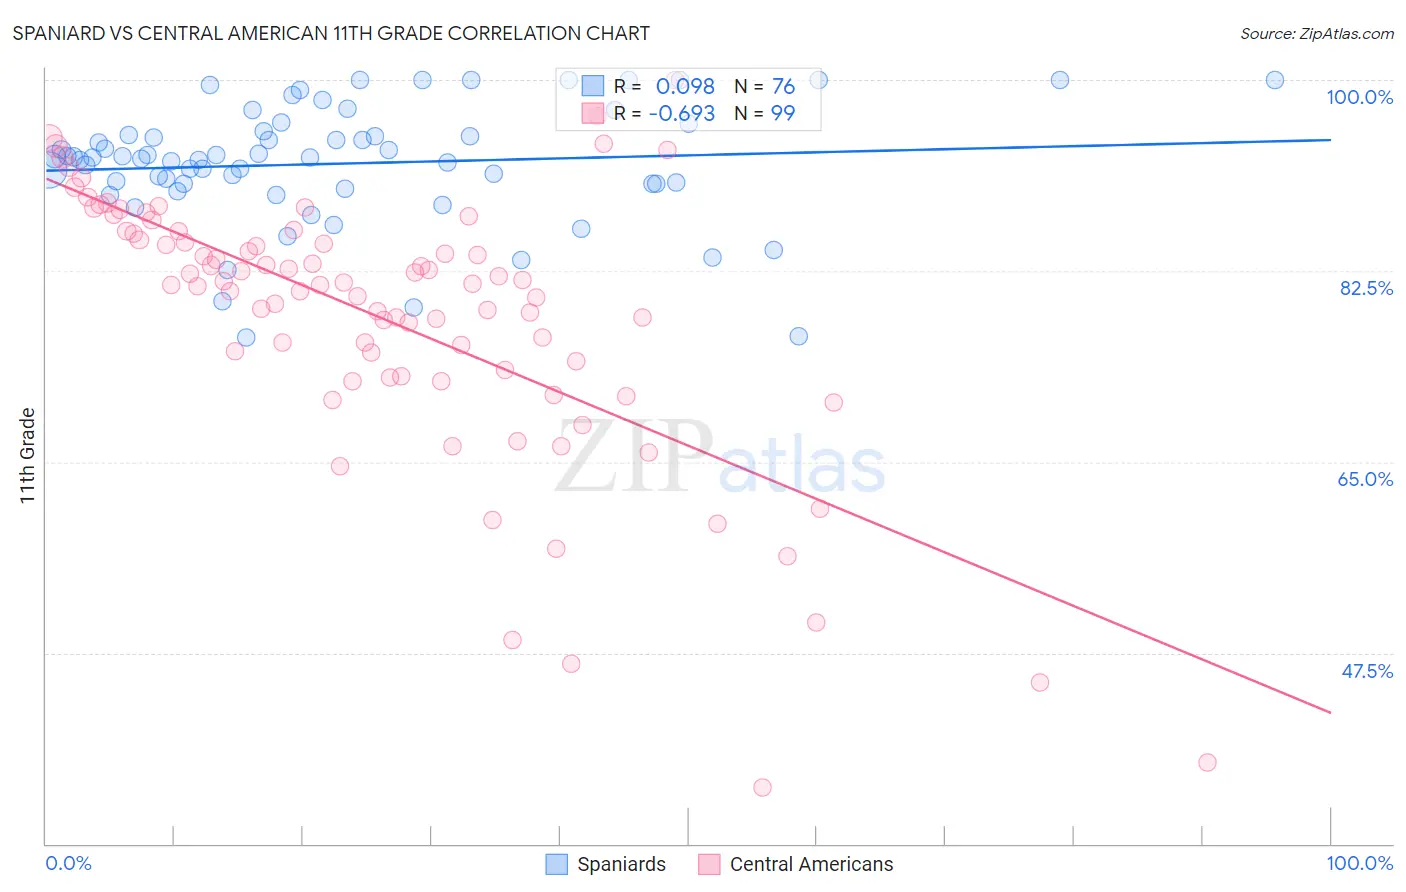
Spaniard vs Central American 11th Grade Correlation Chart
The statistical analysis conducted on geographies consisting of 443,545,794 people shows a slight positive correlation between the proportion of Spaniards and percentage of population with at least 11th grade education in the United States with a correlation coefficient (R) of 0.098 and weighted average of 92.5%. Similarly, the statistical analysis conducted on geographies consisting of 504,619,347 people shows a significant negative correlation between the proportion of Central Americans and percentage of population with at least 11th grade education in the United States with a correlation coefficient (R) of -0.693 and weighted average of 86.9%, a difference of 6.4%.
11th Grade Correlation Summary
| Measurement | Spaniard | Central American |
| Minimum | 76.4% | 35.2% |
| Maximum | 100.0% | 100.0% |
| Range | 23.6% | 64.8% |
| Mean | 92.3% | 78.1% |
| Median | 92.9% | 81.3% |
| Interquartile 25% (IQ1) | 90.5% | 72.9% |
| Interquartile 75% (IQ3) | 95.1% | 85.9% |
| Interquartile Range (IQR) | 4.6% | 13.0% |
| Standard Deviation (Sample) | 5.4% | 12.4% |
| Standard Deviation (Population) | 5.4% | 12.3% |
Similar Demographics by 11th Grade
Demographics Similar to Spaniards by 11th Grade
In terms of 11th grade, the demographic groups most similar to Spaniards are Shoshone (92.5%, a difference of 0.020%), Guamanian/Chamorro (92.5%, a difference of 0.020%), Asian (92.5%, a difference of 0.030%), Sudanese (92.5%, a difference of 0.030%), and Immigrants from Pakistan (92.5%, a difference of 0.050%).
| Demographics | Rating | Rank | 11th Grade |
| Immigrants | Albania | 57.8 /100 | #169 | Average 92.6% |
| Immigrants | Northern Africa | 57.3 /100 | #170 | Average 92.6% |
| Laotians | 54.4 /100 | #171 | Average 92.6% |
| Immigrants | Pakistan | 52.3 /100 | #172 | Average 92.5% |
| Indians (Asian) | 51.5 /100 | #173 | Average 92.5% |
| Asians | 50.0 /100 | #174 | Average 92.5% |
| Shoshone | 48.9 /100 | #175 | Average 92.5% |
| Spaniards | 46.9 /100 | #176 | Average 92.5% |
| Guamanians/Chamorros | 45.0 /100 | #177 | Average 92.5% |
| Sudanese | 43.4 /100 | #178 | Average 92.5% |
| Creek | 40.9 /100 | #179 | Average 92.4% |
| Inupiat | 40.7 /100 | #180 | Average 92.4% |
| Cherokee | 40.7 /100 | #181 | Average 92.4% |
| Immigrants | Morocco | 38.6 /100 | #182 | Fair 92.4% |
| Immigrants | Malaysia | 37.6 /100 | #183 | Fair 92.4% |
Demographics Similar to Central Americans by 11th Grade
In terms of 11th grade, the demographic groups most similar to Central Americans are Immigrants from Dominican Republic (86.9%, a difference of 0.040%), Immigrants from Honduras (86.9%, a difference of 0.040%), Houma (87.0%, a difference of 0.10%), Immigrants from Yemen (87.1%, a difference of 0.16%), and Immigrants from Latin America (86.8%, a difference of 0.17%).
| Demographics | Rating | Rank | 11th Grade |
| Tohono O'odham | 0.0 /100 | #328 | Tragic 87.6% |
| Mexican American Indians | 0.0 /100 | #329 | Tragic 87.5% |
| Hondurans | 0.0 /100 | #330 | Tragic 87.4% |
| Hispanics or Latinos | 0.0 /100 | #331 | Tragic 87.3% |
| Immigrants | Azores | 0.0 /100 | #332 | Tragic 87.2% |
| Immigrants | Yemen | 0.0 /100 | #333 | Tragic 87.1% |
| Houma | 0.0 /100 | #334 | Tragic 87.0% |
| Central Americans | 0.0 /100 | #335 | Tragic 86.9% |
| Immigrants | Dominican Republic | 0.0 /100 | #336 | Tragic 86.9% |
| Immigrants | Honduras | 0.0 /100 | #337 | Tragic 86.9% |
| Immigrants | Latin America | 0.0 /100 | #338 | Tragic 86.8% |
| Guatemalans | 0.0 /100 | #339 | Tragic 86.4% |
| Salvadorans | 0.0 /100 | #340 | Tragic 86.2% |
| Mexicans | 0.0 /100 | #341 | Tragic 86.1% |
| Immigrants | Guatemala | 0.0 /100 | #342 | Tragic 85.8% |