Immigrants from Iraq vs Central American 9th Grade
COMPARE
Immigrants from Iraq
Central American
9th Grade
9th Grade Comparison
Immigrants from Iraq
Central Americans
94.9%
9TH GRADE
47.8/ 100
METRIC RATING
177th/ 347
METRIC RANK
90.4%
9TH GRADE
0.0/ 100
METRIC RATING
338th/ 347
METRIC RANK
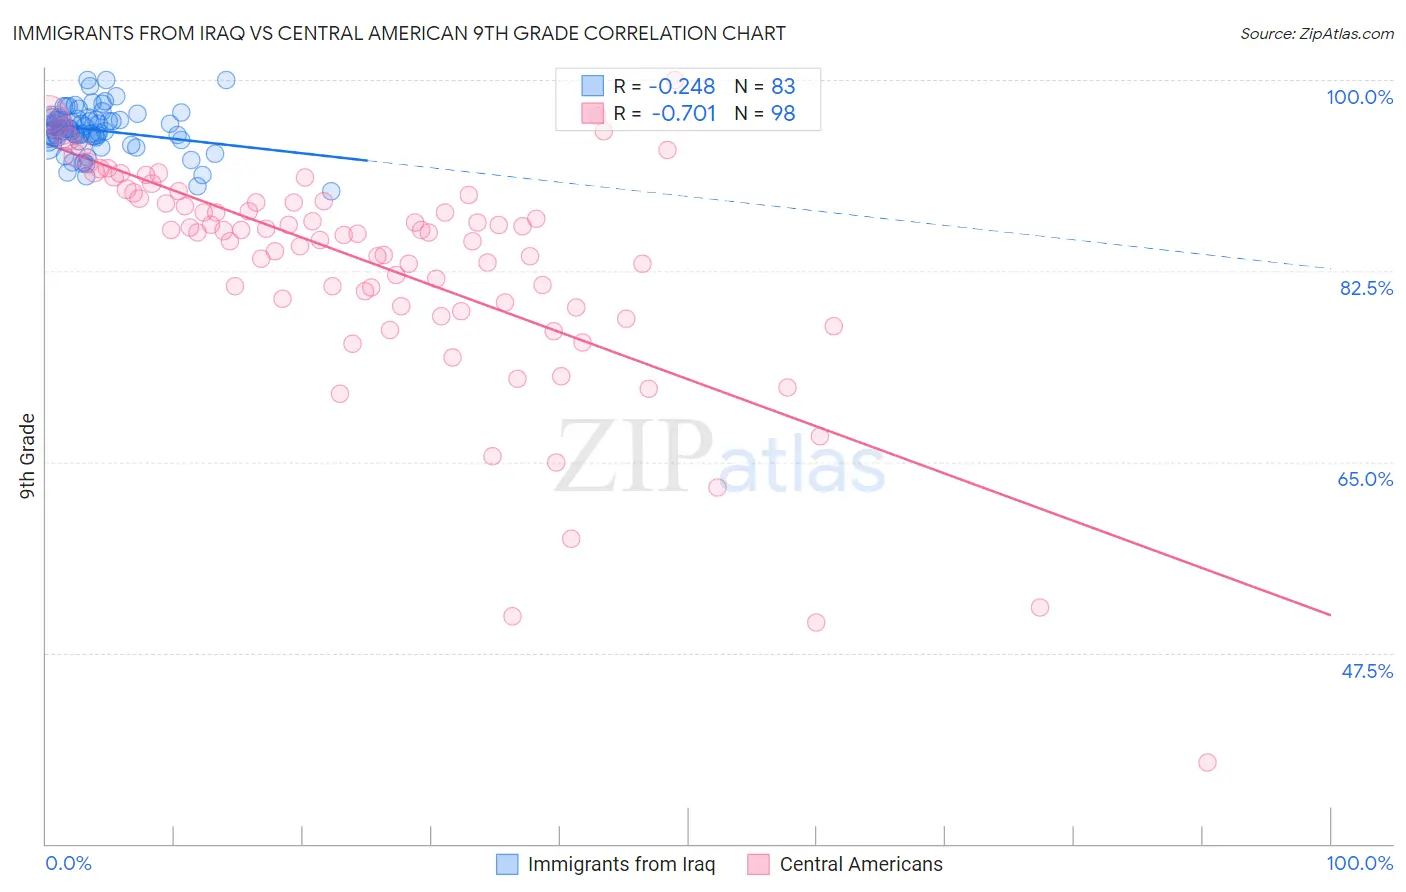
Immigrants from Iraq vs Central American 9th Grade Correlation Chart
The statistical analysis conducted on geographies consisting of 194,632,332 people shows a weak negative correlation between the proportion of Immigrants from Iraq and percentage of population with at least 9th grade education in the United States with a correlation coefficient (R) of -0.248 and weighted average of 94.9%. Similarly, the statistical analysis conducted on geographies consisting of 504,619,198 people shows a strong negative correlation between the proportion of Central Americans and percentage of population with at least 9th grade education in the United States with a correlation coefficient (R) of -0.701 and weighted average of 90.4%, a difference of 5.0%.
9th Grade Correlation Summary
| Measurement | Immigrants from Iraq | Central American |
| Minimum | 89.8% | 37.5% |
| Maximum | 100.0% | 100.0% |
| Range | 10.2% | 62.5% |
| Mean | 95.4% | 82.9% |
| Median | 95.4% | 86.0% |
| Interquartile 25% (IQ1) | 94.7% | 79.3% |
| Interquartile 75% (IQ3) | 96.5% | 89.2% |
| Interquartile Range (IQR) | 1.7% | 9.9% |
| Standard Deviation (Sample) | 2.0% | 10.7% |
| Standard Deviation (Population) | 2.0% | 10.7% |
Similar Demographics by 9th Grade
Demographics Similar to Immigrants from Iraq by 9th Grade
In terms of 9th grade, the demographic groups most similar to Immigrants from Iraq are Brazilian (94.9%, a difference of 0.010%), Immigrants from Spain (94.9%, a difference of 0.010%), Immigrants from Poland (94.9%, a difference of 0.010%), Immigrants from Venezuela (94.9%, a difference of 0.010%), and Immigrants from Egypt (94.9%, a difference of 0.020%).
| Demographics | Rating | Rank | 9th Grade |
| Alsatians | 58.6 /100 | #170 | Average 94.9% |
| Colville | 58.5 /100 | #171 | Average 94.9% |
| Iraqis | 54.0 /100 | #172 | Average 94.9% |
| Cheyenne | 51.5 /100 | #173 | Average 94.9% |
| Immigrants | Egypt | 50.0 /100 | #174 | Average 94.9% |
| Brazilians | 49.8 /100 | #175 | Average 94.9% |
| Immigrants | Spain | 49.1 /100 | #176 | Average 94.9% |
| Immigrants | Iraq | 47.8 /100 | #177 | Average 94.9% |
| Immigrants | Poland | 46.7 /100 | #178 | Average 94.9% |
| Immigrants | Venezuela | 46.5 /100 | #179 | Average 94.9% |
| Immigrants | Uganda | 43.1 /100 | #180 | Average 94.8% |
| Sierra Leoneans | 42.7 /100 | #181 | Average 94.8% |
| Seminole | 42.5 /100 | #182 | Average 94.8% |
| Immigrants | Nepal | 39.7 /100 | #183 | Fair 94.8% |
| Argentineans | 37.6 /100 | #184 | Fair 94.8% |
Demographics Similar to Central Americans by 9th Grade
In terms of 9th grade, the demographic groups most similar to Central Americans are Immigrants from Latin America (90.4%, a difference of 0.010%), Immigrants from Dominican Republic (90.5%, a difference of 0.13%), Immigrants from Honduras (90.6%, a difference of 0.26%), Yakama (90.1%, a difference of 0.34%), and Mexican (90.0%, a difference of 0.40%).
| Demographics | Rating | Rank | 9th Grade |
| Mexican American Indians | 0.0 /100 | #331 | Tragic 90.9% |
| Hispanics or Latinos | 0.0 /100 | #332 | Tragic 90.9% |
| Immigrants | Yemen | 0.0 /100 | #333 | Tragic 90.8% |
| Immigrants | Azores | 0.0 /100 | #334 | Tragic 90.8% |
| Immigrants | Honduras | 0.0 /100 | #335 | Tragic 90.6% |
| Immigrants | Dominican Republic | 0.0 /100 | #336 | Tragic 90.5% |
| Immigrants | Latin America | 0.0 /100 | #337 | Tragic 90.4% |
| Central Americans | 0.0 /100 | #338 | Tragic 90.4% |
| Yakama | 0.0 /100 | #339 | Tragic 90.1% |
| Mexicans | 0.0 /100 | #340 | Tragic 90.0% |
| Guatemalans | 0.0 /100 | #341 | Tragic 89.9% |
| Salvadorans | 0.0 /100 | #342 | Tragic 89.6% |
| Immigrants | Guatemala | 0.0 /100 | #343 | Tragic 89.4% |
| Immigrants | El Salvador | 0.0 /100 | #344 | Tragic 89.0% |
| Immigrants | Central America | 0.0 /100 | #345 | Tragic 89.0% |