Soviet Union vs Albanian 9th Grade
COMPARE
Soviet Union
Albanian
9th Grade
9th Grade Comparison
Soviet Union
Albanians
95.4%
9TH GRADE
95.6/ 100
METRIC RATING
119th/ 347
METRIC RANK
95.1%
9TH GRADE
76.1/ 100
METRIC RATING
153rd/ 347
METRIC RANK
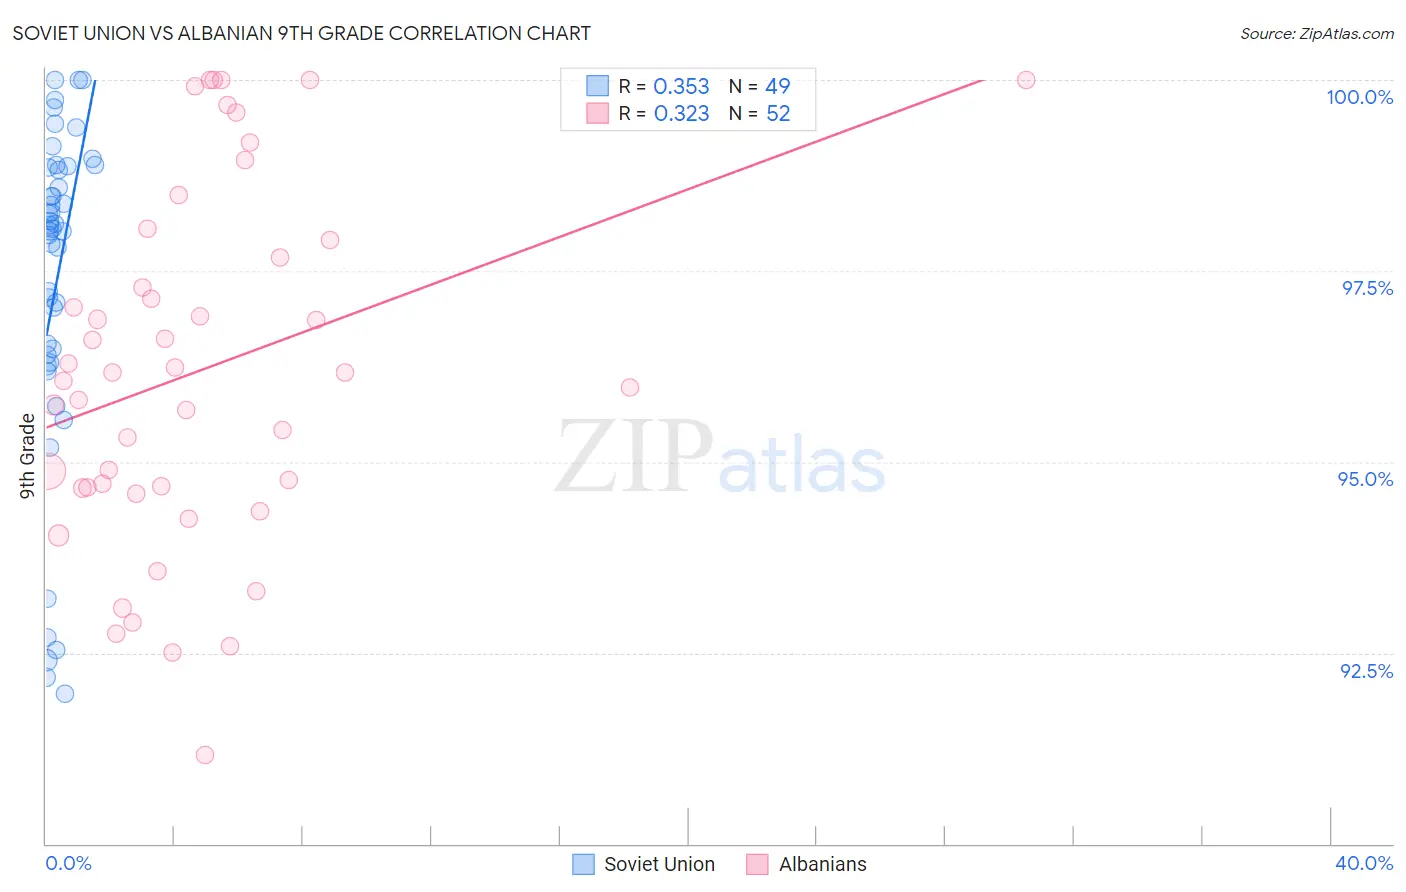
Soviet Union vs Albanian 9th Grade Correlation Chart
The statistical analysis conducted on geographies consisting of 43,454,395 people shows a mild positive correlation between the proportion of Soviet Union and percentage of population with at least 9th grade education in the United States with a correlation coefficient (R) of 0.353 and weighted average of 95.4%. Similarly, the statistical analysis conducted on geographies consisting of 193,265,850 people shows a mild positive correlation between the proportion of Albanians and percentage of population with at least 9th grade education in the United States with a correlation coefficient (R) of 0.323 and weighted average of 95.1%, a difference of 0.35%.
9th Grade Correlation Summary
| Measurement | Soviet Union | Albanian |
| Minimum | 92.0% | 91.2% |
| Maximum | 100.0% | 100.0% |
| Range | 8.0% | 8.8% |
| Mean | 97.3% | 96.2% |
| Median | 98.1% | 96.1% |
| Interquartile 25% (IQ1) | 96.3% | 94.7% |
| Interquartile 75% (IQ3) | 98.9% | 97.8% |
| Interquartile Range (IQR) | 2.5% | 3.1% |
| Standard Deviation (Sample) | 2.2% | 2.3% |
| Standard Deviation (Population) | 2.2% | 2.3% |
Similar Demographics by 9th Grade
Demographics Similar to Soviet Union by 9th Grade
In terms of 9th grade, the demographic groups most similar to Soviet Union are Immigrants from Europe (95.4%, a difference of 0.0%), Immigrants from Romania (95.4%, a difference of 0.0%), Immigrants from Turkey (95.4%, a difference of 0.0%), Cambodian (95.4%, a difference of 0.0%), and Cree (95.4%, a difference of 0.0%).
| Demographics | Rating | Rank | 9th Grade |
| Immigrants | Croatia | 96.2 /100 | #112 | Exceptional 95.4% |
| Iroquois | 96.2 /100 | #113 | Exceptional 95.4% |
| German Russians | 96.1 /100 | #114 | Exceptional 95.4% |
| Burmese | 96.0 /100 | #115 | Exceptional 95.4% |
| Immigrants | Europe | 95.7 /100 | #116 | Exceptional 95.4% |
| Immigrants | Romania | 95.6 /100 | #117 | Exceptional 95.4% |
| Immigrants | Turkey | 95.6 /100 | #118 | Exceptional 95.4% |
| Soviet Union | 95.6 /100 | #119 | Exceptional 95.4% |
| Cambodians | 95.6 /100 | #120 | Exceptional 95.4% |
| Cree | 95.5 /100 | #121 | Exceptional 95.4% |
| Immigrants | Kuwait | 95.5 /100 | #122 | Exceptional 95.4% |
| Kiowa | 95.3 /100 | #123 | Exceptional 95.4% |
| Shoshone | 95.3 /100 | #124 | Exceptional 95.4% |
| Immigrants | South Central Asia | 95.1 /100 | #125 | Exceptional 95.4% |
| Immigrants | Serbia | 94.4 /100 | #126 | Exceptional 95.4% |
Demographics Similar to Albanians by 9th Grade
In terms of 9th grade, the demographic groups most similar to Albanians are Cajun (95.1%, a difference of 0.010%), Ugandan (95.1%, a difference of 0.010%), Arab (95.1%, a difference of 0.010%), Immigrants from Kazakhstan (95.1%, a difference of 0.010%), and Kenyan (95.1%, a difference of 0.030%).
| Demographics | Rating | Rank | 9th Grade |
| Immigrants | Sri Lanka | 82.1 /100 | #146 | Excellent 95.1% |
| Choctaw | 81.9 /100 | #147 | Excellent 95.1% |
| Immigrants | Jordan | 81.2 /100 | #148 | Excellent 95.1% |
| Immigrants | Korea | 79.6 /100 | #149 | Good 95.1% |
| Kenyans | 79.1 /100 | #150 | Good 95.1% |
| Cajuns | 77.3 /100 | #151 | Good 95.1% |
| Ugandans | 77.0 /100 | #152 | Good 95.1% |
| Albanians | 76.1 /100 | #153 | Good 95.1% |
| Arabs | 74.9 /100 | #154 | Good 95.1% |
| Immigrants | Kazakhstan | 74.7 /100 | #155 | Good 95.1% |
| Immigrants | Kenya | 73.1 /100 | #156 | Good 95.0% |
| Mongolians | 73.0 /100 | #157 | Good 95.0% |
| Egyptians | 70.1 /100 | #158 | Good 95.0% |
| Immigrants | Ukraine | 67.4 /100 | #159 | Good 95.0% |
| Immigrants | Italy | 66.6 /100 | #160 | Good 95.0% |