Cape Verdean vs Northern European 9th Grade
COMPARE
Cape Verdean
Northern European
9th Grade
9th Grade Comparison
Cape Verdeans
Northern Europeans
92.2%
9TH GRADE
0.0/ 100
METRIC RATING
316th/ 347
METRIC RANK
96.2%
9TH GRADE
99.9/ 100
METRIC RATING
36th/ 347
METRIC RANK
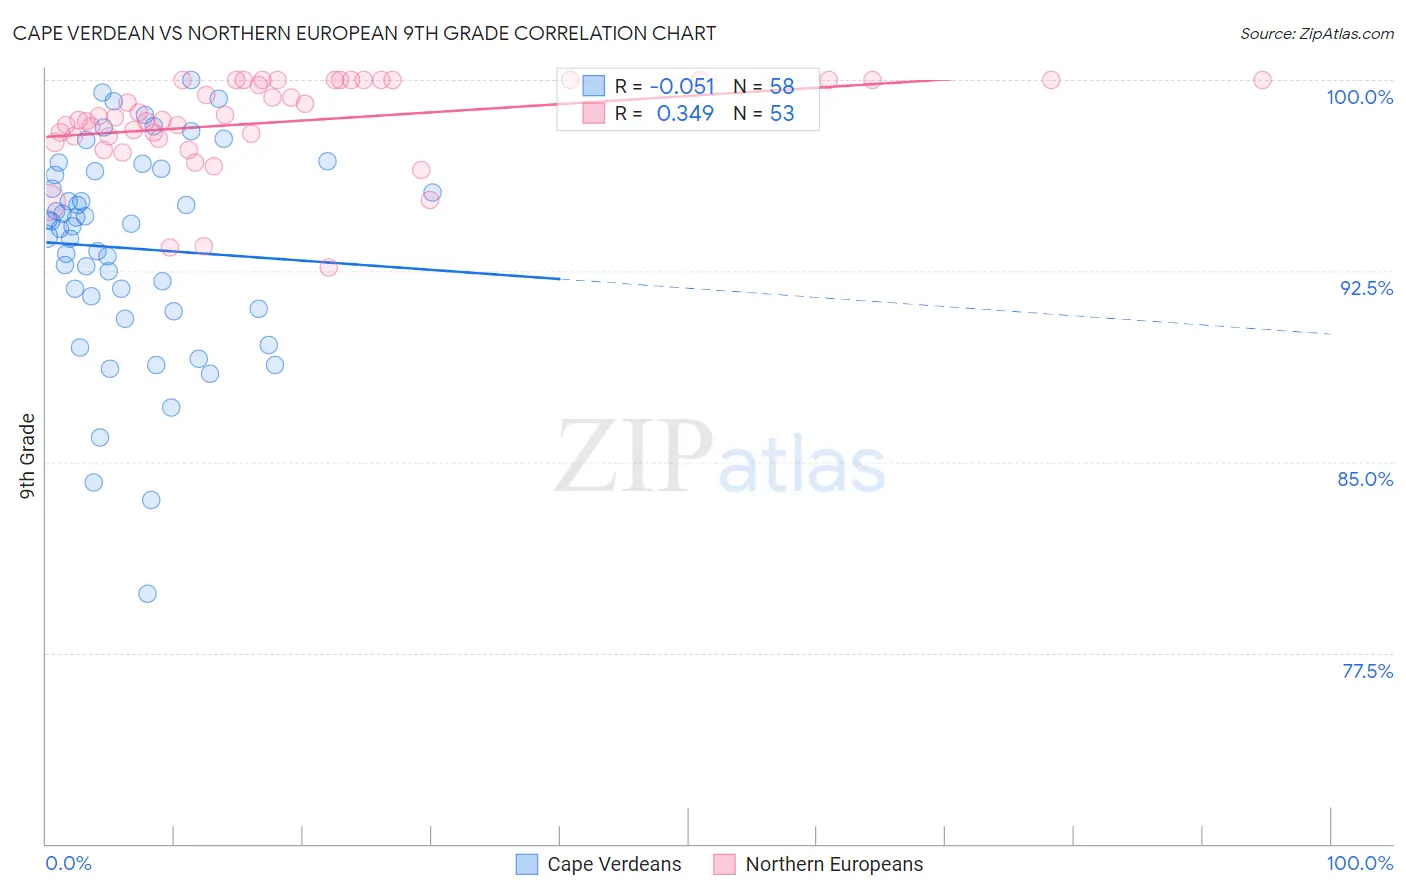
Cape Verdean vs Northern European 9th Grade Correlation Chart
The statistical analysis conducted on geographies consisting of 107,537,955 people shows a slight negative correlation between the proportion of Cape Verdeans and percentage of population with at least 9th grade education in the United States with a correlation coefficient (R) of -0.051 and weighted average of 92.2%. Similarly, the statistical analysis conducted on geographies consisting of 406,096,351 people shows a mild positive correlation between the proportion of Northern Europeans and percentage of population with at least 9th grade education in the United States with a correlation coefficient (R) of 0.349 and weighted average of 96.2%, a difference of 4.3%.
9th Grade Correlation Summary
| Measurement | Cape Verdean | Northern European |
| Minimum | 79.8% | 92.6% |
| Maximum | 100.0% | 100.0% |
| Range | 20.2% | 7.4% |
| Mean | 93.4% | 98.4% |
| Median | 94.3% | 98.5% |
| Interquartile 25% (IQ1) | 91.0% | 97.7% |
| Interquartile 75% (IQ3) | 96.4% | 100.0% |
| Interquartile Range (IQR) | 5.4% | 2.3% |
| Standard Deviation (Sample) | 4.2% | 1.8% |
| Standard Deviation (Population) | 4.2% | 1.8% |
Similar Demographics by 9th Grade
Demographics Similar to Cape Verdeans by 9th Grade
In terms of 9th grade, the demographic groups most similar to Cape Verdeans are Immigrants from Cuba (92.2%, a difference of 0.010%), Immigrants from Caribbean (92.2%, a difference of 0.040%), Immigrants from Portugal (92.2%, a difference of 0.050%), Vietnamese (92.3%, a difference of 0.090%), and Houma (92.3%, a difference of 0.11%).
| Demographics | Rating | Rank | 9th Grade |
| Immigrants | Bangladesh | 0.0 /100 | #309 | Tragic 92.4% |
| Immigrants | Cambodia | 0.0 /100 | #310 | Tragic 92.4% |
| Immigrants | Fiji | 0.0 /100 | #311 | Tragic 92.3% |
| Houma | 0.0 /100 | #312 | Tragic 92.3% |
| Vietnamese | 0.0 /100 | #313 | Tragic 92.3% |
| Immigrants | Portugal | 0.0 /100 | #314 | Tragic 92.2% |
| Immigrants | Caribbean | 0.0 /100 | #315 | Tragic 92.2% |
| Cape Verdeans | 0.0 /100 | #316 | Tragic 92.2% |
| Immigrants | Cuba | 0.0 /100 | #317 | Tragic 92.2% |
| Nepalese | 0.0 /100 | #318 | Tragic 92.0% |
| Ecuadorians | 0.0 /100 | #319 | Tragic 91.9% |
| Nicaraguans | 0.0 /100 | #320 | Tragic 91.9% |
| Immigrants | Ecuador | 0.0 /100 | #321 | Tragic 91.8% |
| Belizeans | 0.0 /100 | #322 | Tragic 91.8% |
| Puerto Ricans | 0.0 /100 | #323 | Tragic 91.8% |
Demographics Similar to Northern Europeans by 9th Grade
In terms of 9th grade, the demographic groups most similar to Northern Europeans are Bulgarian (96.2%, a difference of 0.010%), Hungarian (96.2%, a difference of 0.040%), Estonian (96.1%, a difference of 0.040%), Immigrants from Scotland (96.1%, a difference of 0.040%), and Ottawa (96.1%, a difference of 0.060%).
| Demographics | Rating | Rank | 9th Grade |
| Chinese | 100.0 /100 | #29 | Exceptional 96.3% |
| Maltese | 100.0 /100 | #30 | Exceptional 96.3% |
| British | 100.0 /100 | #31 | Exceptional 96.3% |
| Belgians | 100.0 /100 | #32 | Exceptional 96.3% |
| Luxembourgers | 100.0 /100 | #33 | Exceptional 96.3% |
| Hungarians | 100.0 /100 | #34 | Exceptional 96.2% |
| Bulgarians | 99.9 /100 | #35 | Exceptional 96.2% |
| Northern Europeans | 99.9 /100 | #36 | Exceptional 96.2% |
| Estonians | 99.9 /100 | #37 | Exceptional 96.1% |
| Immigrants | Scotland | 99.9 /100 | #38 | Exceptional 96.1% |
| Ottawa | 99.9 /100 | #39 | Exceptional 96.1% |
| Slavs | 99.9 /100 | #40 | Exceptional 96.1% |
| Czechoslovakians | 99.9 /100 | #41 | Exceptional 96.1% |
| Chippewa | 99.9 /100 | #42 | Exceptional 96.1% |
| Iranians | 99.9 /100 | #43 | Exceptional 96.1% |