South American vs Inupiat Master's Degree
COMPARE
South American
Inupiat
Master's Degree
Master's Degree Comparison
South Americans
Inupiat
15.6%
MASTER'S DEGREE
81.3/ 100
METRIC RATING
145th/ 347
METRIC RANK
10.5%
MASTER'S DEGREE
0.0/ 100
METRIC RATING
325th/ 347
METRIC RANK
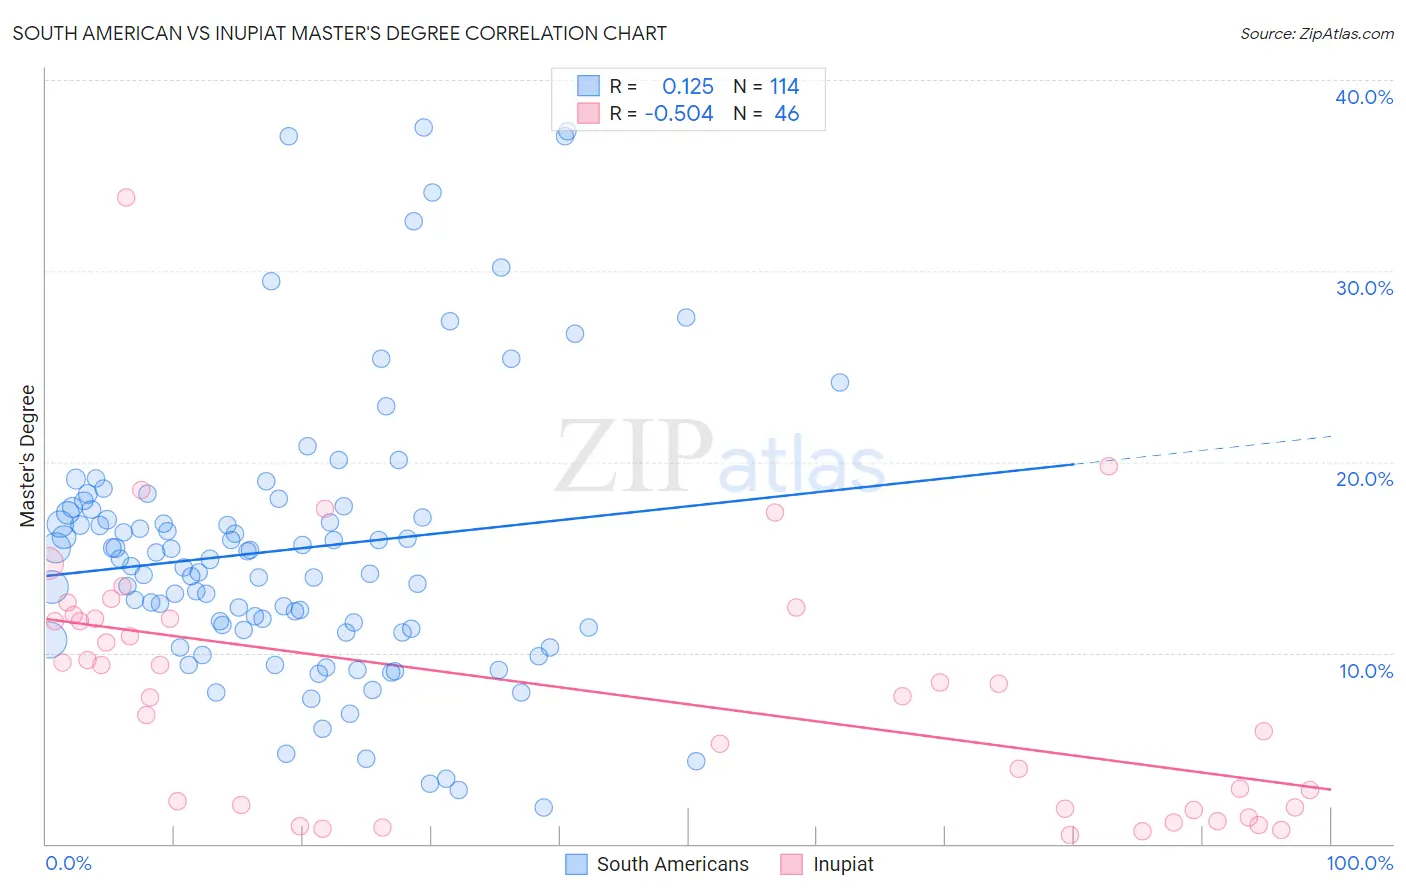
South American vs Inupiat Master's Degree Correlation Chart
The statistical analysis conducted on geographies consisting of 493,882,123 people shows a poor positive correlation between the proportion of South Americans and percentage of population with at least master's degree education in the United States with a correlation coefficient (R) of 0.125 and weighted average of 15.6%. Similarly, the statistical analysis conducted on geographies consisting of 96,329,602 people shows a substantial negative correlation between the proportion of Inupiat and percentage of population with at least master's degree education in the United States with a correlation coefficient (R) of -0.504 and weighted average of 10.5%, a difference of 48.6%.
Master's Degree Correlation Summary
| Measurement | South American | Inupiat |
| Minimum | 1.9% | 0.47% |
| Maximum | 37.5% | 33.9% |
| Range | 35.6% | 33.4% |
| Mean | 15.4% | 8.0% |
| Median | 14.7% | 8.1% |
| Interquartile 25% (IQ1) | 11.2% | 1.8% |
| Interquartile 75% (IQ3) | 17.5% | 11.8% |
| Interquartile Range (IQR) | 6.3% | 10.0% |
| Standard Deviation (Sample) | 7.3% | 6.8% |
| Standard Deviation (Population) | 7.3% | 6.8% |
Similar Demographics by Master's Degree
Demographics Similar to South Americans by Master's Degree
In terms of master's degree, the demographic groups most similar to South Americans are Immigrants from Afghanistan (15.6%, a difference of 0.37%), Hungarian (15.6%, a difference of 0.41%), Canadian (15.7%, a difference of 0.42%), Immigrants from Venezuela (15.7%, a difference of 0.50%), and Immigrants from Senegal (15.5%, a difference of 0.58%).
| Demographics | Rating | Rank | Master's Degree |
| Pakistanis | 86.1 /100 | #138 | Excellent 15.8% |
| Immigrants | Germany | 85.9 /100 | #139 | Excellent 15.8% |
| Vietnamese | 85.5 /100 | #140 | Excellent 15.8% |
| Poles | 85.0 /100 | #141 | Excellent 15.7% |
| Immigrants | Africa | 84.0 /100 | #142 | Excellent 15.7% |
| Immigrants | Venezuela | 83.6 /100 | #143 | Excellent 15.7% |
| Canadians | 83.3 /100 | #144 | Excellent 15.7% |
| South Americans | 81.3 /100 | #145 | Excellent 15.6% |
| Immigrants | Afghanistan | 79.4 /100 | #146 | Good 15.6% |
| Hungarians | 79.1 /100 | #147 | Good 15.6% |
| Immigrants | Senegal | 78.2 /100 | #148 | Good 15.5% |
| Ghanaians | 78.2 /100 | #149 | Good 15.5% |
| Slovenes | 78.0 /100 | #150 | Good 15.5% |
| Iraqis | 77.3 /100 | #151 | Good 15.5% |
| Slavs | 77.0 /100 | #152 | Good 15.5% |
Demographics Similar to Inupiat by Master's Degree
In terms of master's degree, the demographic groups most similar to Inupiat are Creek (10.5%, a difference of 0.0%), Paiute (10.5%, a difference of 0.18%), Bangladeshi (10.5%, a difference of 0.32%), Nepalese (10.5%, a difference of 0.40%), and Dutch West Indian (10.6%, a difference of 1.1%).
| Demographics | Rating | Rank | Master's Degree |
| Immigrants | Cuba | 0.0 /100 | #318 | Tragic 10.9% |
| Kiowa | 0.0 /100 | #319 | Tragic 10.8% |
| Immigrants | Micronesia | 0.0 /100 | #320 | Tragic 10.8% |
| Pennsylvania Germans | 0.0 /100 | #321 | Tragic 10.7% |
| Sioux | 0.0 /100 | #322 | Tragic 10.7% |
| Crow | 0.0 /100 | #323 | Tragic 10.6% |
| Dutch West Indians | 0.0 /100 | #324 | Tragic 10.6% |
| Inupiat | 0.0 /100 | #325 | Tragic 10.5% |
| Creek | 0.0 /100 | #326 | Tragic 10.5% |
| Paiute | 0.0 /100 | #327 | Tragic 10.5% |
| Bangladeshis | 0.0 /100 | #328 | Tragic 10.5% |
| Nepalese | 0.0 /100 | #329 | Tragic 10.5% |
| Fijians | 0.0 /100 | #330 | Tragic 10.3% |
| Pueblo | 0.0 /100 | #331 | Tragic 10.3% |
| Immigrants | Azores | 0.0 /100 | #332 | Tragic 10.2% |