South American vs Albanian Master's Degree
COMPARE
South American
Albanian
Master's Degree
Master's Degree Comparison
South Americans
Albanians
15.6%
MASTER'S DEGREE
81.3/ 100
METRIC RATING
145th/ 347
METRIC RANK
17.0%
MASTER'S DEGREE
98.7/ 100
METRIC RATING
100th/ 347
METRIC RANK
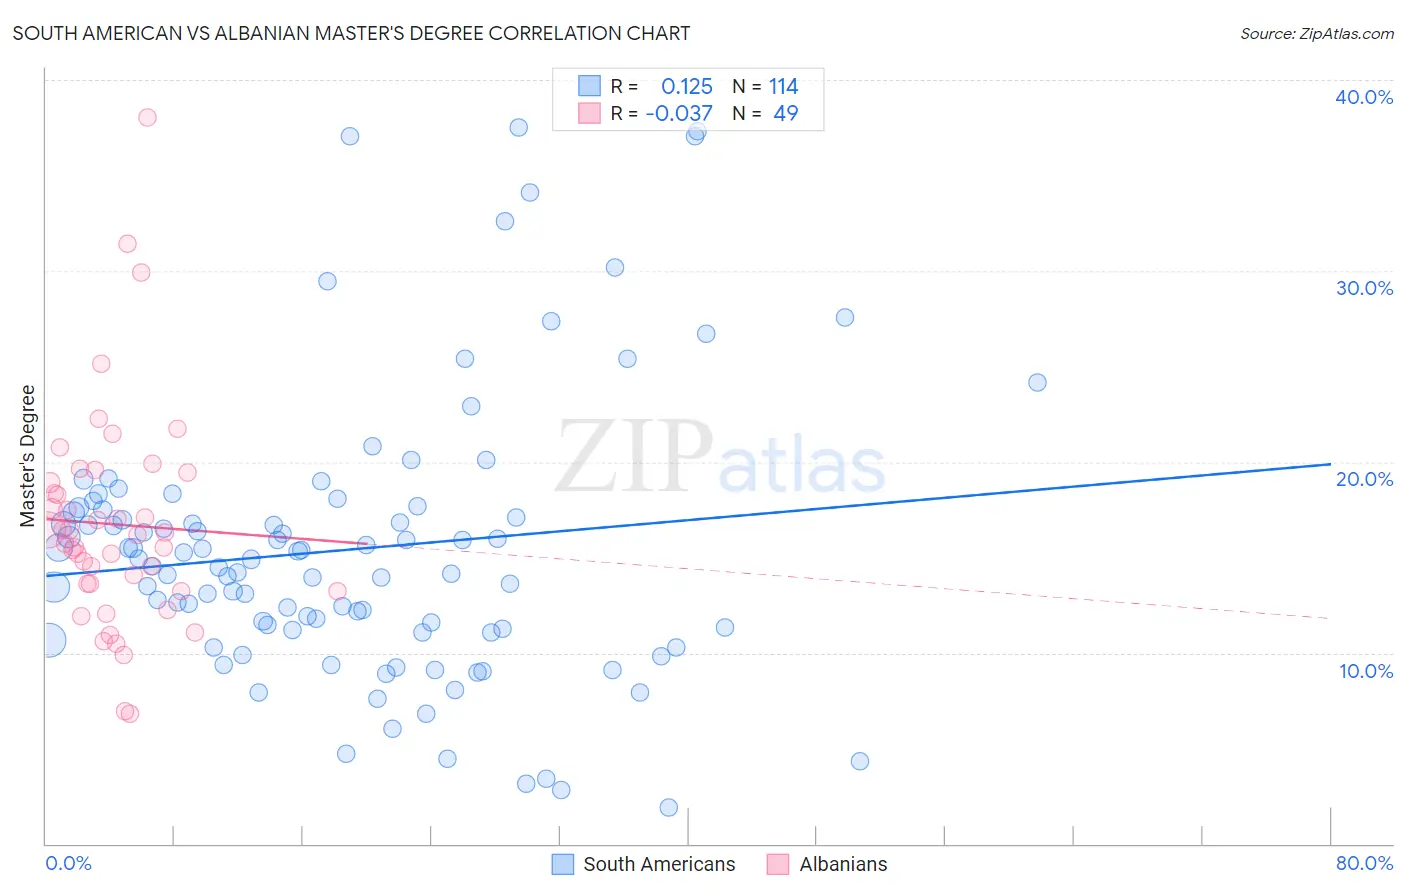
South American vs Albanian Master's Degree Correlation Chart
The statistical analysis conducted on geographies consisting of 493,882,123 people shows a poor positive correlation between the proportion of South Americans and percentage of population with at least master's degree education in the United States with a correlation coefficient (R) of 0.125 and weighted average of 15.6%. Similarly, the statistical analysis conducted on geographies consisting of 193,228,225 people shows no correlation between the proportion of Albanians and percentage of population with at least master's degree education in the United States with a correlation coefficient (R) of -0.037 and weighted average of 17.0%, a difference of 8.7%.
Master's Degree Correlation Summary
| Measurement | South American | Albanian |
| Minimum | 1.9% | 6.8% |
| Maximum | 37.5% | 38.0% |
| Range | 35.6% | 31.2% |
| Mean | 15.4% | 16.7% |
| Median | 14.7% | 16.2% |
| Interquartile 25% (IQ1) | 11.2% | 13.4% |
| Interquartile 75% (IQ3) | 17.5% | 19.2% |
| Interquartile Range (IQR) | 6.3% | 5.8% |
| Standard Deviation (Sample) | 7.3% | 5.7% |
| Standard Deviation (Population) | 7.3% | 5.7% |
Similar Demographics by Master's Degree
Demographics Similar to South Americans by Master's Degree
In terms of master's degree, the demographic groups most similar to South Americans are Immigrants from Afghanistan (15.6%, a difference of 0.37%), Hungarian (15.6%, a difference of 0.41%), Canadian (15.7%, a difference of 0.42%), Immigrants from Venezuela (15.7%, a difference of 0.50%), and Immigrants from Senegal (15.5%, a difference of 0.58%).
| Demographics | Rating | Rank | Master's Degree |
| Pakistanis | 86.1 /100 | #138 | Excellent 15.8% |
| Immigrants | Germany | 85.9 /100 | #139 | Excellent 15.8% |
| Vietnamese | 85.5 /100 | #140 | Excellent 15.8% |
| Poles | 85.0 /100 | #141 | Excellent 15.7% |
| Immigrants | Africa | 84.0 /100 | #142 | Excellent 15.7% |
| Immigrants | Venezuela | 83.6 /100 | #143 | Excellent 15.7% |
| Canadians | 83.3 /100 | #144 | Excellent 15.7% |
| South Americans | 81.3 /100 | #145 | Excellent 15.6% |
| Immigrants | Afghanistan | 79.4 /100 | #146 | Good 15.6% |
| Hungarians | 79.1 /100 | #147 | Good 15.6% |
| Immigrants | Senegal | 78.2 /100 | #148 | Good 15.5% |
| Ghanaians | 78.2 /100 | #149 | Good 15.5% |
| Slovenes | 78.0 /100 | #150 | Good 15.5% |
| Iraqis | 77.3 /100 | #151 | Good 15.5% |
| Slavs | 77.0 /100 | #152 | Good 15.5% |
Demographics Similar to Albanians by Master's Degree
In terms of master's degree, the demographic groups most similar to Albanians are Immigrants from Nepal (17.0%, a difference of 0.18%), Laotian (17.0%, a difference of 0.21%), Chilean (16.9%, a difference of 0.26%), Immigrants from Ukraine (17.0%, a difference of 0.27%), and Immigrants from England (17.0%, a difference of 0.36%).
| Demographics | Rating | Rank | Master's Degree |
| Immigrants | Italy | 99.1 /100 | #93 | Exceptional 17.2% |
| Ugandans | 99.0 /100 | #94 | Exceptional 17.1% |
| Immigrants | Morocco | 98.9 /100 | #95 | Exceptional 17.1% |
| Immigrants | Northern Africa | 98.9 /100 | #96 | Exceptional 17.1% |
| Immigrants | England | 98.8 /100 | #97 | Exceptional 17.0% |
| Immigrants | Ukraine | 98.8 /100 | #98 | Exceptional 17.0% |
| Laotians | 98.8 /100 | #99 | Exceptional 17.0% |
| Albanians | 98.7 /100 | #100 | Exceptional 17.0% |
| Immigrants | Nepal | 98.6 /100 | #101 | Exceptional 17.0% |
| Chileans | 98.6 /100 | #102 | Exceptional 16.9% |
| Alsatians | 98.4 /100 | #103 | Exceptional 16.9% |
| Ukrainians | 98.3 /100 | #104 | Exceptional 16.9% |
| Syrians | 98.3 /100 | #105 | Exceptional 16.8% |
| Immigrants | Albania | 98.1 /100 | #106 | Exceptional 16.8% |
| Armenians | 98.0 /100 | #107 | Exceptional 16.8% |