Luxembourger vs Inupiat Master's Degree
COMPARE
Luxembourger
Inupiat
Master's Degree
Master's Degree Comparison
Luxembourgers
Inupiat
15.3%
MASTER'S DEGREE
71.0/ 100
METRIC RATING
159th/ 347
METRIC RANK
10.5%
MASTER'S DEGREE
0.0/ 100
METRIC RATING
325th/ 347
METRIC RANK
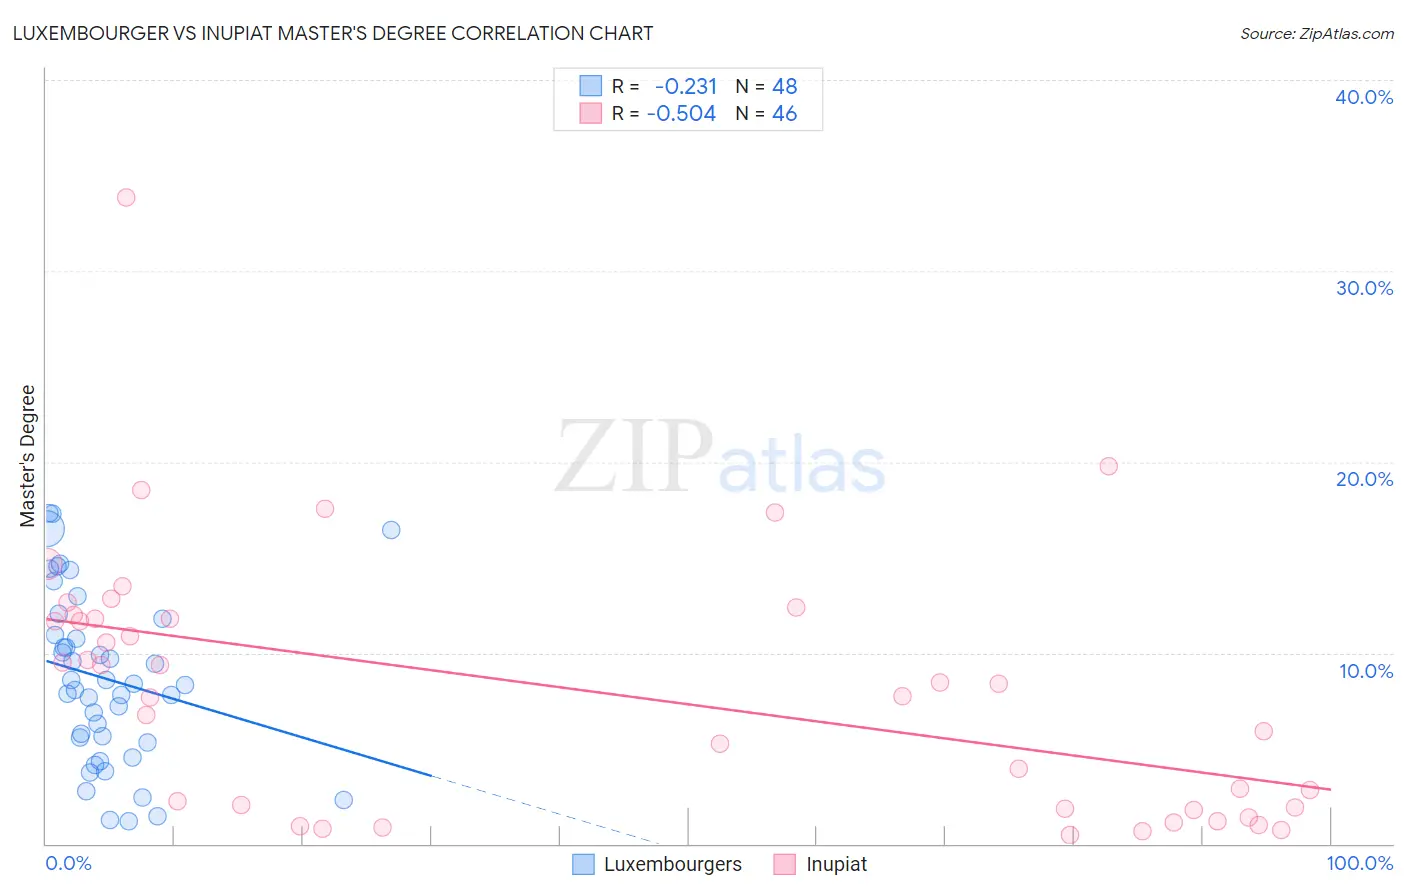
Luxembourger vs Inupiat Master's Degree Correlation Chart
The statistical analysis conducted on geographies consisting of 144,650,519 people shows a weak negative correlation between the proportion of Luxembourgers and percentage of population with at least master's degree education in the United States with a correlation coefficient (R) of -0.231 and weighted average of 15.3%. Similarly, the statistical analysis conducted on geographies consisting of 96,329,602 people shows a substantial negative correlation between the proportion of Inupiat and percentage of population with at least master's degree education in the United States with a correlation coefficient (R) of -0.504 and weighted average of 10.5%, a difference of 46.0%.
Master's Degree Correlation Summary
| Measurement | Luxembourger | Inupiat |
| Minimum | 1.2% | 0.47% |
| Maximum | 17.3% | 33.9% |
| Range | 16.1% | 33.4% |
| Mean | 8.6% | 8.0% |
| Median | 8.3% | 8.1% |
| Interquartile 25% (IQ1) | 5.5% | 1.8% |
| Interquartile 75% (IQ3) | 11.4% | 11.8% |
| Interquartile Range (IQR) | 5.9% | 10.0% |
| Standard Deviation (Sample) | 4.4% | 6.8% |
| Standard Deviation (Population) | 4.4% | 6.8% |
Similar Demographics by Master's Degree
Demographics Similar to Luxembourgers by Master's Degree
In terms of master's degree, the demographic groups most similar to Luxembourgers are Immigrants from Poland (15.4%, a difference of 0.070%), Immigrants from Cameroon (15.4%, a difference of 0.11%), Kenyan (15.3%, a difference of 0.11%), Sudanese (15.3%, a difference of 0.34%), and Peruvian (15.3%, a difference of 0.35%).
| Demographics | Rating | Rank | Master's Degree |
| Slavs | 77.0 /100 | #152 | Good 15.5% |
| Icelanders | 76.8 /100 | #153 | Good 15.5% |
| Immigrants | South America | 76.3 /100 | #154 | Good 15.5% |
| Immigrants | Bangladesh | 76.1 /100 | #155 | Good 15.5% |
| Bermudans | 73.9 /100 | #156 | Good 15.4% |
| Immigrants | Cameroon | 71.7 /100 | #157 | Good 15.4% |
| Immigrants | Poland | 71.5 /100 | #158 | Good 15.4% |
| Luxembourgers | 71.0 /100 | #159 | Good 15.3% |
| Kenyans | 70.3 /100 | #160 | Good 15.3% |
| Sudanese | 68.7 /100 | #161 | Good 15.3% |
| Peruvians | 68.7 /100 | #162 | Good 15.3% |
| Uruguayans | 67.1 /100 | #163 | Good 15.3% |
| Colombians | 66.9 /100 | #164 | Good 15.3% |
| Immigrants | Kenya | 66.6 /100 | #165 | Good 15.3% |
| Swedes | 66.1 /100 | #166 | Good 15.2% |
Demographics Similar to Inupiat by Master's Degree
In terms of master's degree, the demographic groups most similar to Inupiat are Creek (10.5%, a difference of 0.0%), Paiute (10.5%, a difference of 0.18%), Bangladeshi (10.5%, a difference of 0.32%), Nepalese (10.5%, a difference of 0.40%), and Dutch West Indian (10.6%, a difference of 1.1%).
| Demographics | Rating | Rank | Master's Degree |
| Immigrants | Cuba | 0.0 /100 | #318 | Tragic 10.9% |
| Kiowa | 0.0 /100 | #319 | Tragic 10.8% |
| Immigrants | Micronesia | 0.0 /100 | #320 | Tragic 10.8% |
| Pennsylvania Germans | 0.0 /100 | #321 | Tragic 10.7% |
| Sioux | 0.0 /100 | #322 | Tragic 10.7% |
| Crow | 0.0 /100 | #323 | Tragic 10.6% |
| Dutch West Indians | 0.0 /100 | #324 | Tragic 10.6% |
| Inupiat | 0.0 /100 | #325 | Tragic 10.5% |
| Creek | 0.0 /100 | #326 | Tragic 10.5% |
| Paiute | 0.0 /100 | #327 | Tragic 10.5% |
| Bangladeshis | 0.0 /100 | #328 | Tragic 10.5% |
| Nepalese | 0.0 /100 | #329 | Tragic 10.5% |
| Fijians | 0.0 /100 | #330 | Tragic 10.3% |
| Pueblo | 0.0 /100 | #331 | Tragic 10.3% |
| Immigrants | Azores | 0.0 /100 | #332 | Tragic 10.2% |