South American vs Inupiat Child Poverty Under the Age of 5
COMPARE
South American
Inupiat
Child Poverty Under the Age of 5
Child Poverty Under the Age of 5 Comparison
South Americans
Inupiat
16.7%
CHILD POVERTY UNDER THE AGE OF 5
75.1/ 100
METRIC RATING
155th/ 347
METRIC RANK
22.0%
CHILD POVERTY UNDER THE AGE OF 5
0.0/ 100
METRIC RATING
303rd/ 347
METRIC RANK
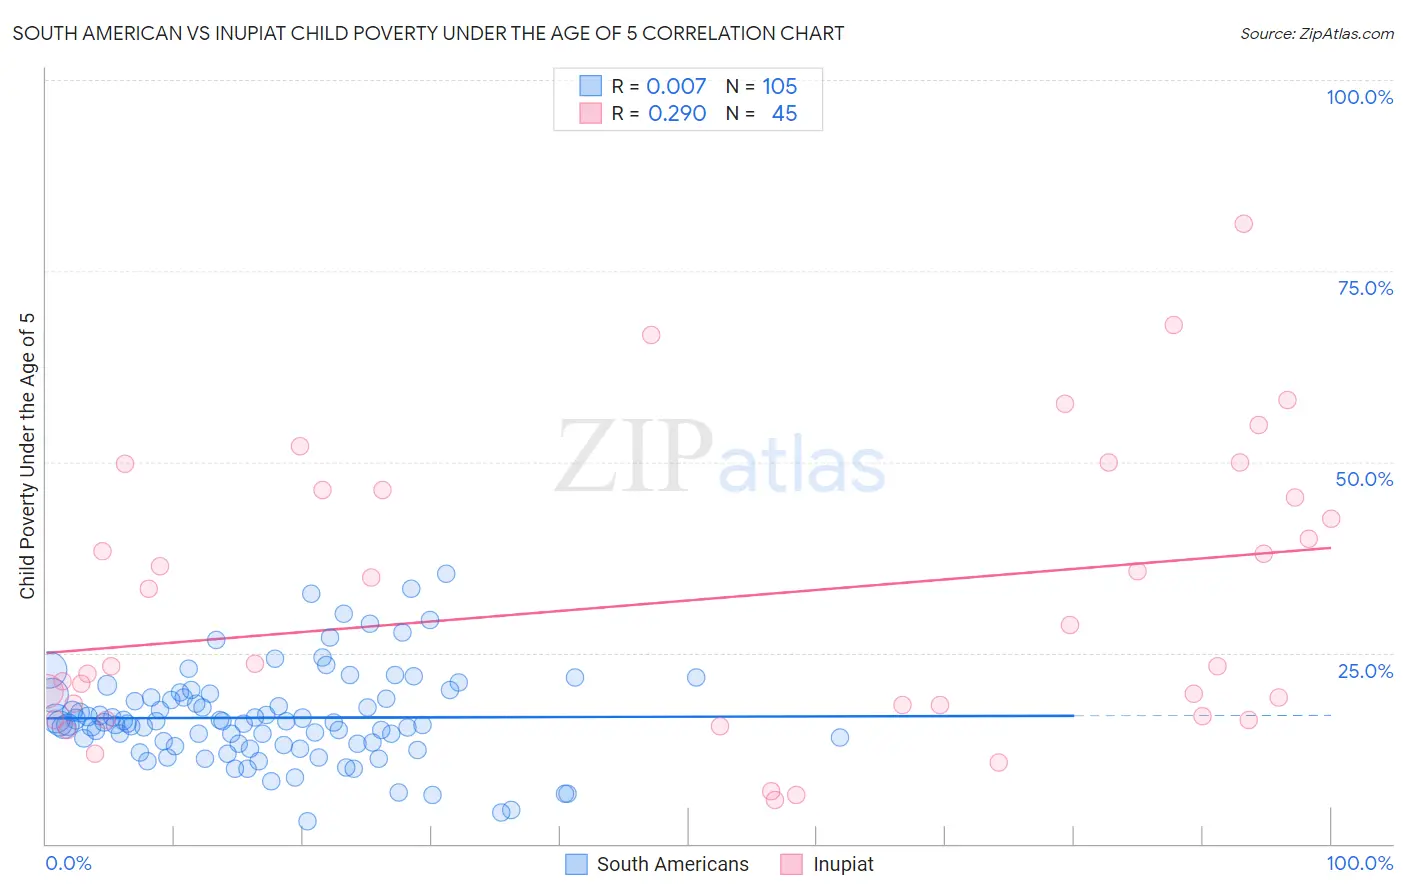
South American vs Inupiat Child Poverty Under the Age of 5 Correlation Chart
The statistical analysis conducted on geographies consisting of 468,225,362 people shows no correlation between the proportion of South Americans and poverty level among children under the age of 5 in the United States with a correlation coefficient (R) of 0.007 and weighted average of 16.7%. Similarly, the statistical analysis conducted on geographies consisting of 95,492,262 people shows a weak positive correlation between the proportion of Inupiat and poverty level among children under the age of 5 in the United States with a correlation coefficient (R) of 0.290 and weighted average of 22.0%, a difference of 31.6%.
Child Poverty Under the Age of 5 Correlation Summary
| Measurement | South American | Inupiat |
| Minimum | 2.9% | 5.8% |
| Maximum | 35.3% | 81.2% |
| Range | 32.4% | 75.5% |
| Mean | 16.5% | 32.0% |
| Median | 15.8% | 23.5% |
| Interquartile 25% (IQ1) | 13.0% | 17.4% |
| Interquartile 75% (IQ3) | 19.3% | 46.3% |
| Interquartile Range (IQR) | 6.3% | 28.8% |
| Standard Deviation (Sample) | 6.1% | 18.5% |
| Standard Deviation (Population) | 6.1% | 18.3% |
Similar Demographics by Child Poverty Under the Age of 5
Demographics Similar to South Americans by Child Poverty Under the Age of 5
In terms of child poverty under the age of 5, the demographic groups most similar to South Americans are Afghan (16.8%, a difference of 0.10%), Immigrants from Venezuela (16.7%, a difference of 0.13%), Venezuelan (16.8%, a difference of 0.19%), Dutch (16.7%, a difference of 0.29%), and Belgian (16.7%, a difference of 0.31%).
| Demographics | Rating | Rank | Child Poverty Under the Age of 5 |
| Syrians | 79.1 /100 | #148 | Good 16.6% |
| New Zealanders | 78.7 /100 | #149 | Good 16.6% |
| Colombians | 77.8 /100 | #150 | Good 16.7% |
| Canadians | 77.6 /100 | #151 | Good 16.7% |
| Belgians | 77.2 /100 | #152 | Good 16.7% |
| Dutch | 77.1 /100 | #153 | Good 16.7% |
| Immigrants | Venezuela | 76.0 /100 | #154 | Good 16.7% |
| South Americans | 75.1 /100 | #155 | Good 16.7% |
| Afghans | 74.4 /100 | #156 | Good 16.8% |
| Venezuelans | 73.7 /100 | #157 | Good 16.8% |
| Czechoslovakians | 72.5 /100 | #158 | Good 16.8% |
| Immigrants | Syria | 72.3 /100 | #159 | Good 16.8% |
| Irish | 72.0 /100 | #160 | Good 16.8% |
| English | 70.4 /100 | #161 | Good 16.8% |
| Costa Ricans | 69.8 /100 | #162 | Good 16.9% |
Demographics Similar to Inupiat by Child Poverty Under the Age of 5
In terms of child poverty under the age of 5, the demographic groups most similar to Inupiat are Iroquois (22.0%, a difference of 0.090%), Immigrants from Guatemala (22.0%, a difference of 0.11%), Immigrants from Central America (22.0%, a difference of 0.25%), Alaskan Athabascan (21.8%, a difference of 0.91%), and Chickasaw (21.8%, a difference of 0.92%).
| Demographics | Rating | Rank | Child Poverty Under the Age of 5 |
| Yaqui | 0.0 /100 | #296 | Tragic 21.7% |
| Hispanics or Latinos | 0.0 /100 | #297 | Tragic 21.7% |
| Blackfeet | 0.0 /100 | #298 | Tragic 21.8% |
| Chickasaw | 0.0 /100 | #299 | Tragic 21.8% |
| Alaskan Athabascans | 0.0 /100 | #300 | Tragic 21.8% |
| Immigrants | Central America | 0.0 /100 | #301 | Tragic 22.0% |
| Iroquois | 0.0 /100 | #302 | Tragic 22.0% |
| Inupiat | 0.0 /100 | #303 | Tragic 22.0% |
| Immigrants | Guatemala | 0.0 /100 | #304 | Tragic 22.0% |
| Immigrants | Mexico | 0.0 /100 | #305 | Tragic 22.2% |
| Indonesians | 0.0 /100 | #306 | Tragic 22.3% |
| Immigrants | Bahamas | 0.0 /100 | #307 | Tragic 22.7% |
| Immigrants | Dominica | 0.0 /100 | #308 | Tragic 22.7% |
| Houma | 0.0 /100 | #309 | Tragic 22.7% |
| Africans | 0.0 /100 | #310 | Tragic 22.8% |