Native/Alaskan vs Inupiat Master's Degree
COMPARE
Native/Alaskan
Inupiat
Master's Degree
Master's Degree Comparison
Natives/Alaskans
Inupiat
9.9%
MASTER'S DEGREE
0.0/ 100
METRIC RATING
336th/ 347
METRIC RANK
10.5%
MASTER'S DEGREE
0.0/ 100
METRIC RATING
325th/ 347
METRIC RANK
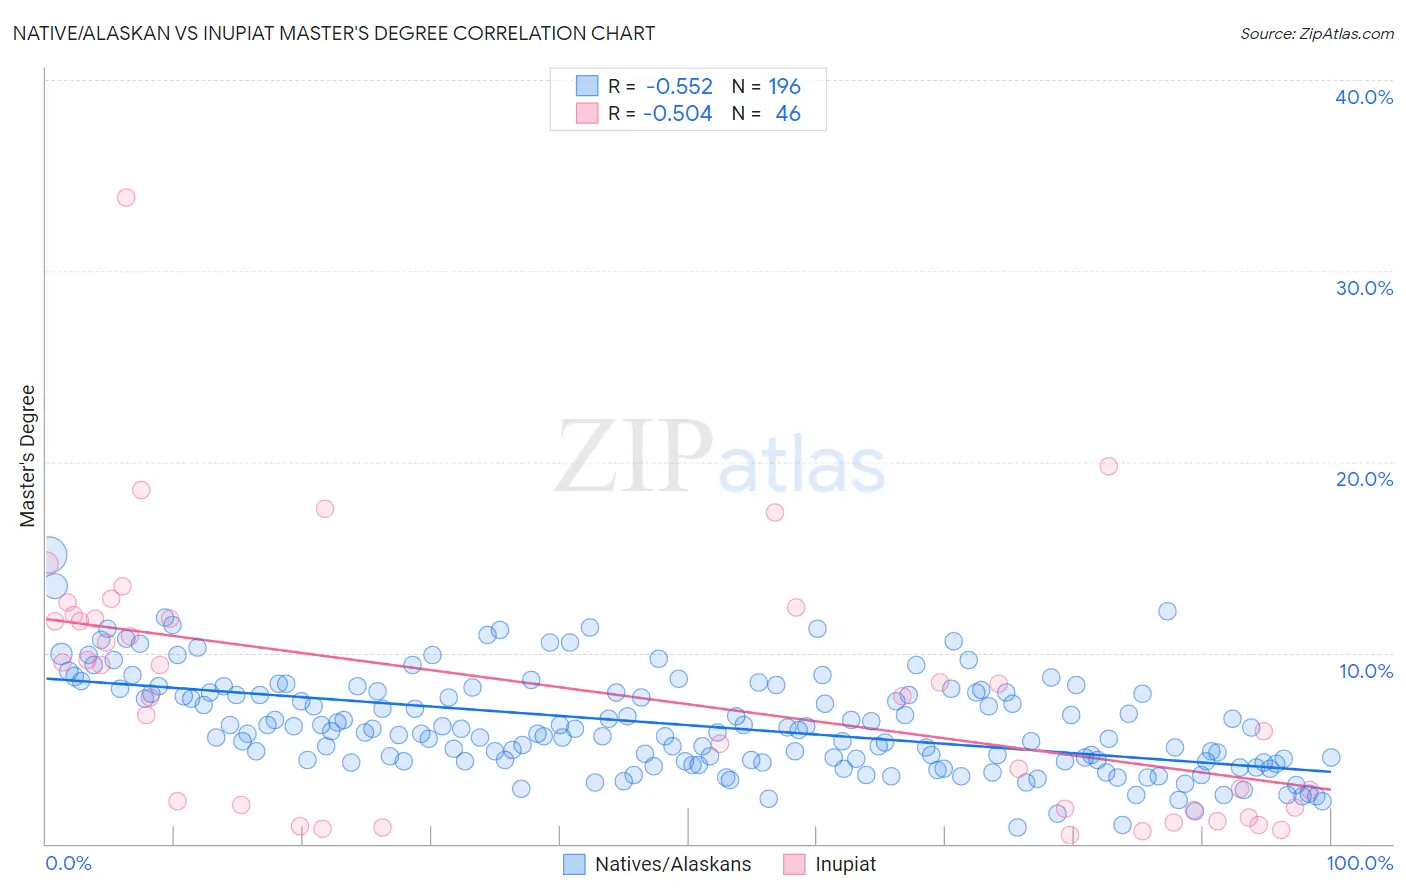
Native/Alaskan vs Inupiat Master's Degree Correlation Chart
The statistical analysis conducted on geographies consisting of 512,468,242 people shows a substantial negative correlation between the proportion of Natives/Alaskans and percentage of population with at least master's degree education in the United States with a correlation coefficient (R) of -0.552 and weighted average of 9.9%. Similarly, the statistical analysis conducted on geographies consisting of 96,329,602 people shows a substantial negative correlation between the proportion of Inupiat and percentage of population with at least master's degree education in the United States with a correlation coefficient (R) of -0.504 and weighted average of 10.5%, a difference of 5.8%.
Master's Degree Correlation Summary
| Measurement | Native/Alaskan | Inupiat |
| Minimum | 0.88% | 0.47% |
| Maximum | 15.1% | 33.9% |
| Range | 14.3% | 33.4% |
| Mean | 6.2% | 8.0% |
| Median | 5.9% | 8.1% |
| Interquartile 25% (IQ1) | 4.3% | 1.8% |
| Interquartile 75% (IQ3) | 7.9% | 11.8% |
| Interquartile Range (IQR) | 3.6% | 10.0% |
| Standard Deviation (Sample) | 2.6% | 6.8% |
| Standard Deviation (Population) | 2.6% | 6.8% |
Demographics Similar to Natives/Alaskans and Inupiat by Master's Degree
In terms of master's degree, the demographic groups most similar to Natives/Alaskans are Immigrants from Central America (10.0%, a difference of 0.50%), Arapaho (10.0%, a difference of 0.64%), Mexican (9.7%, a difference of 2.2%), Tohono O'odham (9.7%, a difference of 2.3%), and Menominee (10.2%, a difference of 2.6%). Similarly, the demographic groups most similar to Inupiat are Creek (10.5%, a difference of 0.0%), Paiute (10.5%, a difference of 0.18%), Bangladeshi (10.5%, a difference of 0.32%), Nepalese (10.5%, a difference of 0.40%), and Dutch West Indian (10.6%, a difference of 1.1%).
| Demographics | Rating | Rank | Master's Degree |
| Immigrants | Micronesia | 0.0 /100 | #320 | Tragic 10.8% |
| Pennsylvania Germans | 0.0 /100 | #321 | Tragic 10.7% |
| Sioux | 0.0 /100 | #322 | Tragic 10.7% |
| Crow | 0.0 /100 | #323 | Tragic 10.6% |
| Dutch West Indians | 0.0 /100 | #324 | Tragic 10.6% |
| Inupiat | 0.0 /100 | #325 | Tragic 10.5% |
| Creek | 0.0 /100 | #326 | Tragic 10.5% |
| Paiute | 0.0 /100 | #327 | Tragic 10.5% |
| Bangladeshis | 0.0 /100 | #328 | Tragic 10.5% |
| Nepalese | 0.0 /100 | #329 | Tragic 10.5% |
| Fijians | 0.0 /100 | #330 | Tragic 10.3% |
| Pueblo | 0.0 /100 | #331 | Tragic 10.3% |
| Immigrants | Azores | 0.0 /100 | #332 | Tragic 10.2% |
| Menominee | 0.0 /100 | #333 | Tragic 10.2% |
| Arapaho | 0.0 /100 | #334 | Tragic 10.0% |
| Immigrants | Central America | 0.0 /100 | #335 | Tragic 10.0% |
| Natives/Alaskans | 0.0 /100 | #336 | Tragic 9.9% |
| Mexicans | 0.0 /100 | #337 | Tragic 9.7% |
| Tohono O'odham | 0.0 /100 | #338 | Tragic 9.7% |
| Spanish American Indians | 0.0 /100 | #339 | Tragic 9.6% |
| Yakama | 0.0 /100 | #340 | Tragic 9.5% |