South American Indian vs Guyanese 8th Grade
COMPARE
South American Indian
Guyanese
8th Grade
8th Grade Comparison
South American Indians
Guyanese
95.1%
8TH GRADE
1.9/ 100
METRIC RATING
241st/ 347
METRIC RANK
93.9%
8TH GRADE
0.0/ 100
METRIC RATING
304th/ 347
METRIC RANK
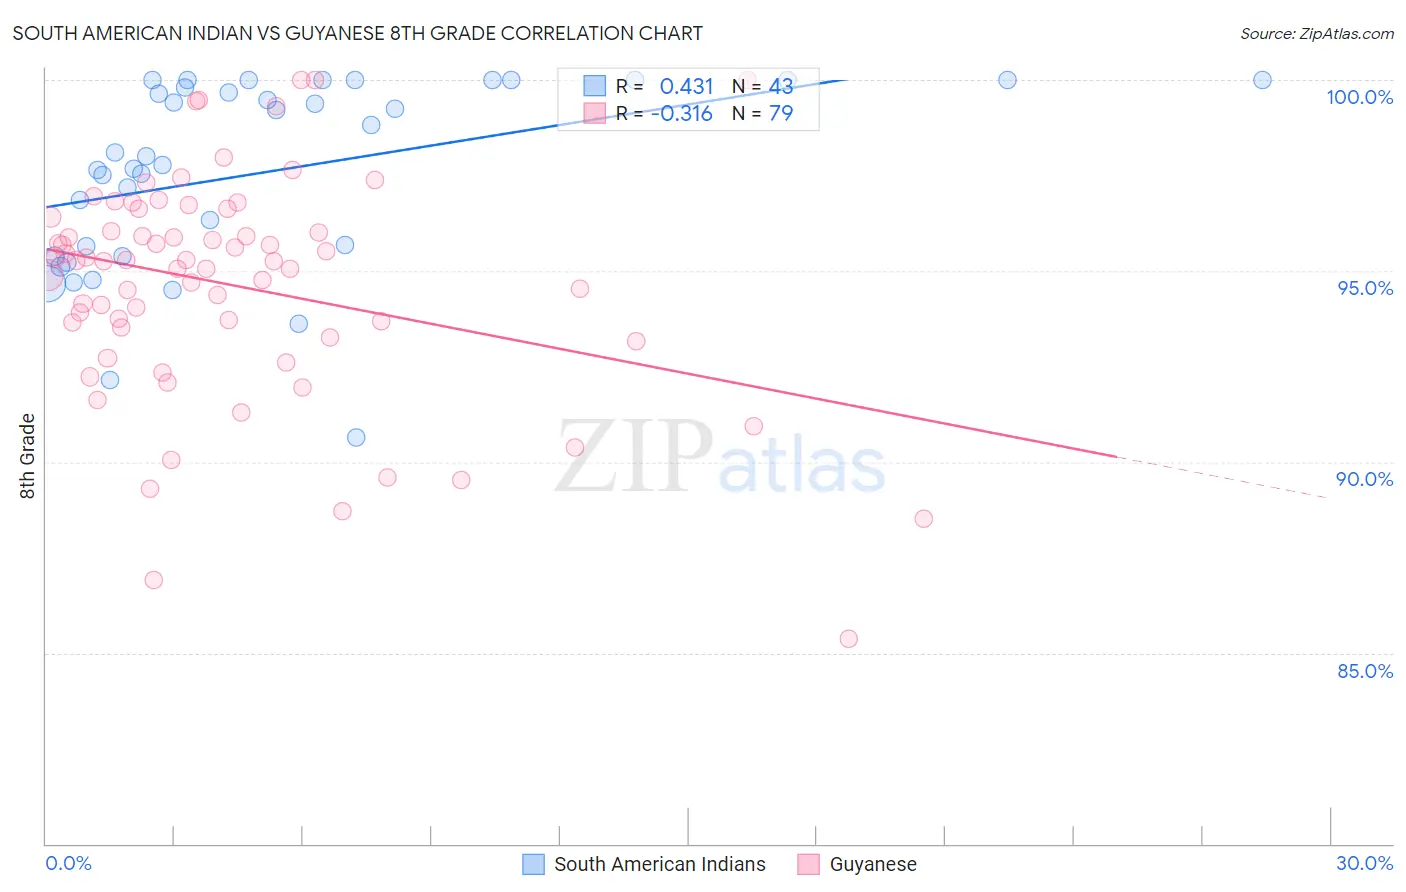
South American Indian vs Guyanese 8th Grade Correlation Chart
The statistical analysis conducted on geographies consisting of 164,573,401 people shows a moderate positive correlation between the proportion of South American Indians and percentage of population with at least 8th grade education in the United States with a correlation coefficient (R) of 0.431 and weighted average of 95.1%. Similarly, the statistical analysis conducted on geographies consisting of 176,937,226 people shows a mild negative correlation between the proportion of Guyanese and percentage of population with at least 8th grade education in the United States with a correlation coefficient (R) of -0.316 and weighted average of 93.9%, a difference of 1.3%.
8th Grade Correlation Summary
| Measurement | South American Indian | Guyanese |
| Minimum | 90.6% | 85.4% |
| Maximum | 100.0% | 100.0% |
| Range | 9.4% | 14.6% |
| Mean | 97.6% | 94.6% |
| Median | 98.0% | 95.3% |
| Interquartile 25% (IQ1) | 95.4% | 93.3% |
| Interquartile 75% (IQ3) | 100.0% | 96.4% |
| Interquartile Range (IQR) | 4.6% | 3.1% |
| Standard Deviation (Sample) | 2.5% | 2.9% |
| Standard Deviation (Population) | 2.4% | 2.9% |
Similar Demographics by 8th Grade
Demographics Similar to South American Indians by 8th Grade
In terms of 8th grade, the demographic groups most similar to South American Indians are Immigrants from Sierra Leone (95.1%, a difference of 0.010%), Ethiopian (95.1%, a difference of 0.010%), Tongan (95.1%, a difference of 0.020%), Paiute (95.1%, a difference of 0.020%), and Immigrants from Middle Africa (95.1%, a difference of 0.020%).
| Demographics | Rating | Rank | 8th Grade |
| Costa Ricans | 3.0 /100 | #234 | Tragic 95.2% |
| Nigerians | 2.9 /100 | #235 | Tragic 95.2% |
| Senegalese | 2.7 /100 | #236 | Tragic 95.2% |
| Immigrants | Africa | 2.7 /100 | #237 | Tragic 95.2% |
| Natives/Alaskans | 2.3 /100 | #238 | Tragic 95.2% |
| Immigrants | Sierra Leone | 2.1 /100 | #239 | Tragic 95.1% |
| Ethiopians | 2.0 /100 | #240 | Tragic 95.1% |
| South American Indians | 1.9 /100 | #241 | Tragic 95.1% |
| Tongans | 1.7 /100 | #242 | Tragic 95.1% |
| Paiute | 1.7 /100 | #243 | Tragic 95.1% |
| Immigrants | Middle Africa | 1.7 /100 | #244 | Tragic 95.1% |
| Jamaicans | 1.4 /100 | #245 | Tragic 95.1% |
| Somalis | 1.4 /100 | #246 | Tragic 95.1% |
| Immigrants | Senegal | 1.4 /100 | #247 | Tragic 95.1% |
| Uruguayans | 1.2 /100 | #248 | Tragic 95.1% |
Demographics Similar to Guyanese by 8th Grade
In terms of 8th grade, the demographic groups most similar to Guyanese are Immigrants from Haiti (93.9%, a difference of 0.030%), Immigrants from Dominica (94.0%, a difference of 0.080%), Sri Lankan (94.0%, a difference of 0.13%), Immigrants from Guyana (93.8%, a difference of 0.13%), and Immigrants from Portugal (93.8%, a difference of 0.14%).
| Demographics | Rating | Rank | 8th Grade |
| Immigrants | South Eastern Asia | 0.0 /100 | #297 | Tragic 94.2% |
| Indonesians | 0.0 /100 | #298 | Tragic 94.1% |
| Cubans | 0.0 /100 | #299 | Tragic 94.1% |
| Immigrants | Burma/Myanmar | 0.0 /100 | #300 | Tragic 94.1% |
| Immigrants | Laos | 0.0 /100 | #301 | Tragic 94.1% |
| Sri Lankans | 0.0 /100 | #302 | Tragic 94.0% |
| Immigrants | Dominica | 0.0 /100 | #303 | Tragic 94.0% |
| Guyanese | 0.0 /100 | #304 | Tragic 93.9% |
| Immigrants | Haiti | 0.0 /100 | #305 | Tragic 93.9% |
| Immigrants | Guyana | 0.0 /100 | #306 | Tragic 93.8% |
| Immigrants | Portugal | 0.0 /100 | #307 | Tragic 93.8% |
| Ecuadorians | 0.0 /100 | #308 | Tragic 93.6% |
| Immigrants | Immigrants | 0.0 /100 | #309 | Tragic 93.6% |
| Japanese | 0.0 /100 | #310 | Tragic 93.6% |
| Immigrants | Bangladesh | 0.0 /100 | #311 | Tragic 93.6% |