Immigrants from Saudi Arabia vs Guyanese 8th Grade
COMPARE
Immigrants from Saudi Arabia
Guyanese
8th Grade
8th Grade Comparison
Immigrants from Saudi Arabia
Guyanese
96.3%
8TH GRADE
98.0/ 100
METRIC RATING
103rd/ 347
METRIC RANK
93.9%
8TH GRADE
0.0/ 100
METRIC RATING
304th/ 347
METRIC RANK
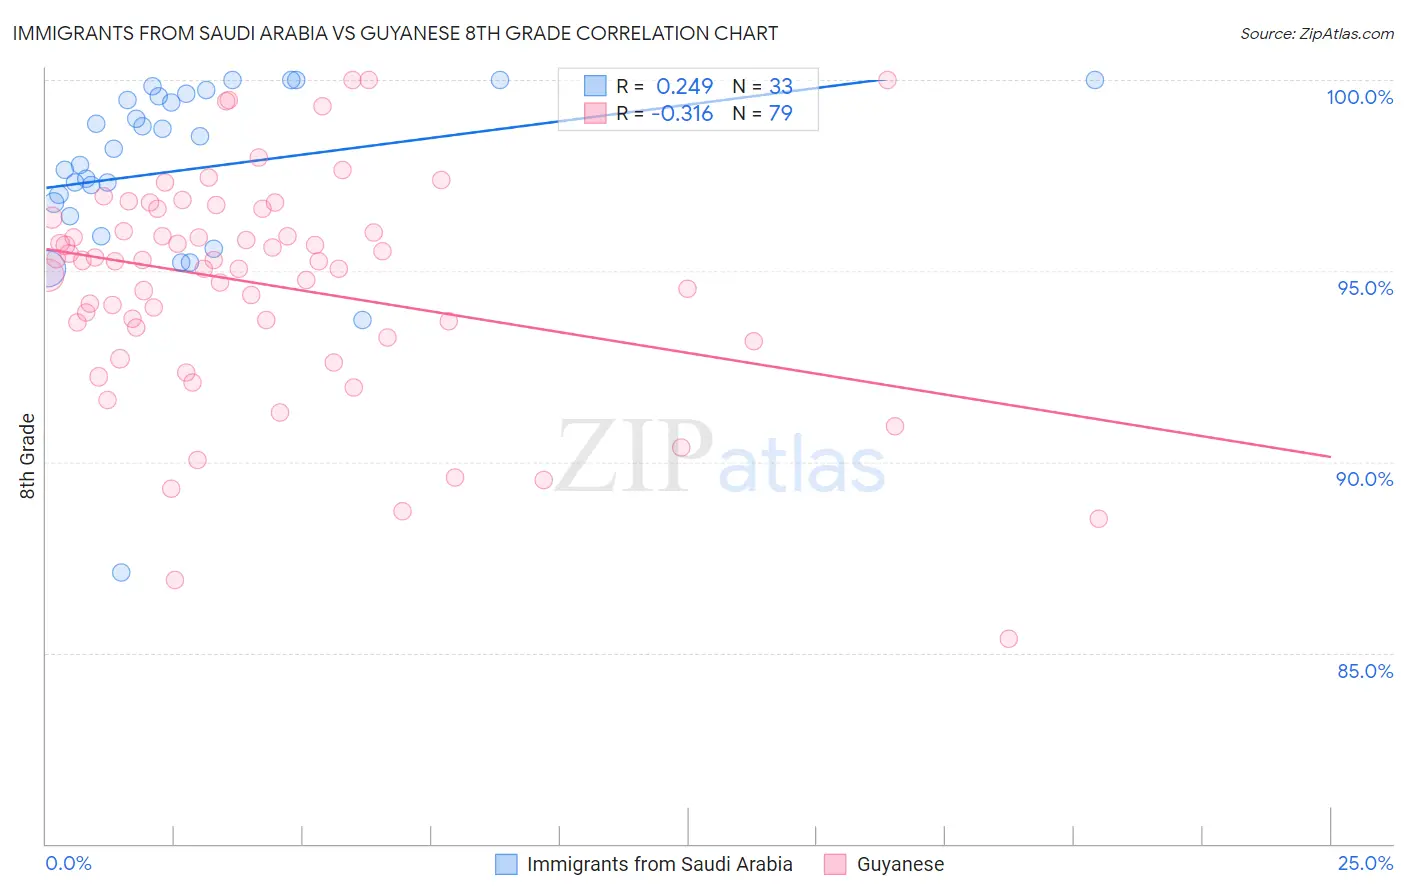
Immigrants from Saudi Arabia vs Guyanese 8th Grade Correlation Chart
The statistical analysis conducted on geographies consisting of 164,277,573 people shows a weak positive correlation between the proportion of Immigrants from Saudi Arabia and percentage of population with at least 8th grade education in the United States with a correlation coefficient (R) of 0.249 and weighted average of 96.3%. Similarly, the statistical analysis conducted on geographies consisting of 176,937,226 people shows a mild negative correlation between the proportion of Guyanese and percentage of population with at least 8th grade education in the United States with a correlation coefficient (R) of -0.316 and weighted average of 93.9%, a difference of 2.6%.
8th Grade Correlation Summary
| Measurement | Immigrants from Saudi Arabia | Guyanese |
| Minimum | 87.1% | 85.4% |
| Maximum | 100.0% | 100.0% |
| Range | 12.9% | 14.6% |
| Mean | 97.7% | 94.6% |
| Median | 98.2% | 95.3% |
| Interquartile 25% (IQ1) | 96.6% | 93.3% |
| Interquartile 75% (IQ3) | 99.6% | 96.4% |
| Interquartile Range (IQR) | 3.0% | 3.1% |
| Standard Deviation (Sample) | 2.6% | 2.9% |
| Standard Deviation (Population) | 2.5% | 2.9% |
Similar Demographics by 8th Grade
Demographics Similar to Immigrants from Saudi Arabia by 8th Grade
In terms of 8th grade, the demographic groups most similar to Immigrants from Saudi Arabia are Kiowa (96.3%, a difference of 0.0%), Immigrants from North Macedonia (96.3%, a difference of 0.0%), Okinawan (96.3%, a difference of 0.0%), South African (96.4%, a difference of 0.010%), and Immigrants from Latvia (96.3%, a difference of 0.010%).
| Demographics | Rating | Rank | 8th Grade |
| Potawatomi | 98.7 /100 | #96 | Exceptional 96.4% |
| Osage | 98.7 /100 | #97 | Exceptional 96.4% |
| Immigrants | Germany | 98.7 /100 | #98 | Exceptional 96.4% |
| Cree | 98.6 /100 | #99 | Exceptional 96.4% |
| Immigrants | Czechoslovakia | 98.6 /100 | #100 | Exceptional 96.4% |
| Bhutanese | 98.2 /100 | #101 | Exceptional 96.4% |
| South Africans | 98.2 /100 | #102 | Exceptional 96.4% |
| Immigrants | Saudi Arabia | 98.0 /100 | #103 | Exceptional 96.3% |
| Kiowa | 98.0 /100 | #104 | Exceptional 96.3% |
| Immigrants | North Macedonia | 98.0 /100 | #105 | Exceptional 96.3% |
| Okinawans | 98.0 /100 | #106 | Exceptional 96.3% |
| Immigrants | Latvia | 97.8 /100 | #107 | Exceptional 96.3% |
| Lebanese | 97.5 /100 | #108 | Exceptional 96.3% |
| Iroquois | 97.5 /100 | #109 | Exceptional 96.3% |
| Cajuns | 97.1 /100 | #110 | Exceptional 96.3% |
Demographics Similar to Guyanese by 8th Grade
In terms of 8th grade, the demographic groups most similar to Guyanese are Immigrants from Haiti (93.9%, a difference of 0.030%), Immigrants from Dominica (94.0%, a difference of 0.080%), Sri Lankan (94.0%, a difference of 0.13%), Immigrants from Guyana (93.8%, a difference of 0.13%), and Immigrants from Portugal (93.8%, a difference of 0.14%).
| Demographics | Rating | Rank | 8th Grade |
| Immigrants | South Eastern Asia | 0.0 /100 | #297 | Tragic 94.2% |
| Indonesians | 0.0 /100 | #298 | Tragic 94.1% |
| Cubans | 0.0 /100 | #299 | Tragic 94.1% |
| Immigrants | Burma/Myanmar | 0.0 /100 | #300 | Tragic 94.1% |
| Immigrants | Laos | 0.0 /100 | #301 | Tragic 94.1% |
| Sri Lankans | 0.0 /100 | #302 | Tragic 94.0% |
| Immigrants | Dominica | 0.0 /100 | #303 | Tragic 94.0% |
| Guyanese | 0.0 /100 | #304 | Tragic 93.9% |
| Immigrants | Haiti | 0.0 /100 | #305 | Tragic 93.9% |
| Immigrants | Guyana | 0.0 /100 | #306 | Tragic 93.8% |
| Immigrants | Portugal | 0.0 /100 | #307 | Tragic 93.8% |
| Ecuadorians | 0.0 /100 | #308 | Tragic 93.6% |
| Immigrants | Immigrants | 0.0 /100 | #309 | Tragic 93.6% |
| Japanese | 0.0 /100 | #310 | Tragic 93.6% |
| Immigrants | Bangladesh | 0.0 /100 | #311 | Tragic 93.6% |