South American Indian vs Colville 8th Grade
COMPARE
South American Indian
Colville
8th Grade
8th Grade Comparison
South American Indians
Colville
95.1%
8TH GRADE
1.9/ 100
METRIC RATING
241st/ 347
METRIC RANK
96.0%
8TH GRADE
84.0/ 100
METRIC RATING
147th/ 347
METRIC RANK
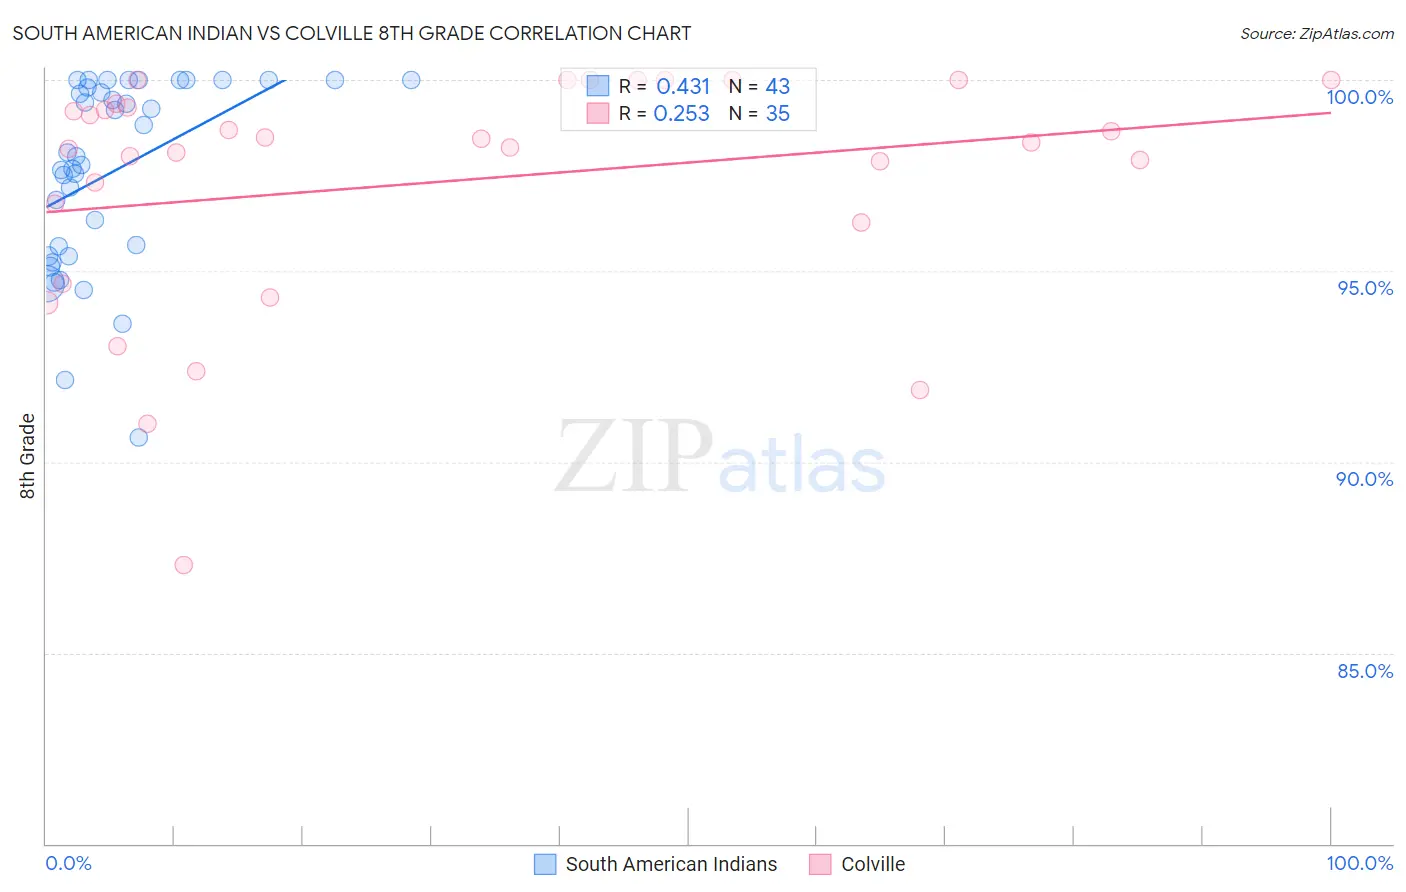
South American Indian vs Colville 8th Grade Correlation Chart
The statistical analysis conducted on geographies consisting of 164,573,401 people shows a moderate positive correlation between the proportion of South American Indians and percentage of population with at least 8th grade education in the United States with a correlation coefficient (R) of 0.431 and weighted average of 95.1%. Similarly, the statistical analysis conducted on geographies consisting of 34,682,094 people shows a weak positive correlation between the proportion of Colville and percentage of population with at least 8th grade education in the United States with a correlation coefficient (R) of 0.253 and weighted average of 96.0%, a difference of 0.91%.
8th Grade Correlation Summary
| Measurement | South American Indian | Colville |
| Minimum | 90.6% | 87.3% |
| Maximum | 100.0% | 100.0% |
| Range | 9.4% | 12.7% |
| Mean | 97.6% | 97.3% |
| Median | 98.0% | 98.4% |
| Interquartile 25% (IQ1) | 95.4% | 96.3% |
| Interquartile 75% (IQ3) | 100.0% | 99.4% |
| Interquartile Range (IQR) | 4.6% | 3.1% |
| Standard Deviation (Sample) | 2.5% | 3.1% |
| Standard Deviation (Population) | 2.4% | 3.1% |
Similar Demographics by 8th Grade
Demographics Similar to South American Indians by 8th Grade
In terms of 8th grade, the demographic groups most similar to South American Indians are Immigrants from Sierra Leone (95.1%, a difference of 0.010%), Ethiopian (95.1%, a difference of 0.010%), Tongan (95.1%, a difference of 0.020%), Paiute (95.1%, a difference of 0.020%), and Immigrants from Middle Africa (95.1%, a difference of 0.020%).
| Demographics | Rating | Rank | 8th Grade |
| Costa Ricans | 3.0 /100 | #234 | Tragic 95.2% |
| Nigerians | 2.9 /100 | #235 | Tragic 95.2% |
| Senegalese | 2.7 /100 | #236 | Tragic 95.2% |
| Immigrants | Africa | 2.7 /100 | #237 | Tragic 95.2% |
| Natives/Alaskans | 2.3 /100 | #238 | Tragic 95.2% |
| Immigrants | Sierra Leone | 2.1 /100 | #239 | Tragic 95.1% |
| Ethiopians | 2.0 /100 | #240 | Tragic 95.1% |
| South American Indians | 1.9 /100 | #241 | Tragic 95.1% |
| Tongans | 1.7 /100 | #242 | Tragic 95.1% |
| Paiute | 1.7 /100 | #243 | Tragic 95.1% |
| Immigrants | Middle Africa | 1.7 /100 | #244 | Tragic 95.1% |
| Jamaicans | 1.4 /100 | #245 | Tragic 95.1% |
| Somalis | 1.4 /100 | #246 | Tragic 95.1% |
| Immigrants | Senegal | 1.4 /100 | #247 | Tragic 95.1% |
| Uruguayans | 1.2 /100 | #248 | Tragic 95.1% |
Demographics Similar to Colville by 8th Grade
In terms of 8th grade, the demographic groups most similar to Colville are Lumbee (96.0%, a difference of 0.0%), Israeli (96.0%, a difference of 0.0%), Spanish (96.0%, a difference of 0.010%), Immigrants from Belarus (96.0%, a difference of 0.010%), and Albanian (96.0%, a difference of 0.010%).
| Demographics | Rating | Rank | 8th Grade |
| Immigrants | South Central Asia | 89.4 /100 | #140 | Excellent 96.1% |
| Immigrants | Greece | 85.9 /100 | #141 | Excellent 96.0% |
| Immigrants | Eastern Europe | 85.4 /100 | #142 | Excellent 96.0% |
| Spanish | 85.1 /100 | #143 | Excellent 96.0% |
| Immigrants | Belarus | 84.8 /100 | #144 | Excellent 96.0% |
| Lumbee | 84.1 /100 | #145 | Excellent 96.0% |
| Israelis | 84.1 /100 | #146 | Excellent 96.0% |
| Colville | 84.0 /100 | #147 | Excellent 96.0% |
| Albanians | 83.1 /100 | #148 | Excellent 96.0% |
| Immigrants | Israel | 81.3 /100 | #149 | Excellent 96.0% |
| Immigrants | Russia | 80.9 /100 | #150 | Excellent 96.0% |
| Blackfeet | 80.8 /100 | #151 | Excellent 96.0% |
| French American Indians | 80.6 /100 | #152 | Excellent 96.0% |
| Immigrants | Jordan | 79.5 /100 | #153 | Good 95.9% |
| Hopi | 79.4 /100 | #154 | Good 95.9% |