South American Indian vs Carpatho Rusyn 8th Grade
COMPARE
South American Indian
Carpatho Rusyn
8th Grade
8th Grade Comparison
South American Indians
Carpatho Rusyns
95.1%
8TH GRADE
1.9/ 100
METRIC RATING
241st/ 347
METRIC RANK
98.1%
8TH GRADE
100.0/ 100
METRIC RATING
4th/ 347
METRIC RANK
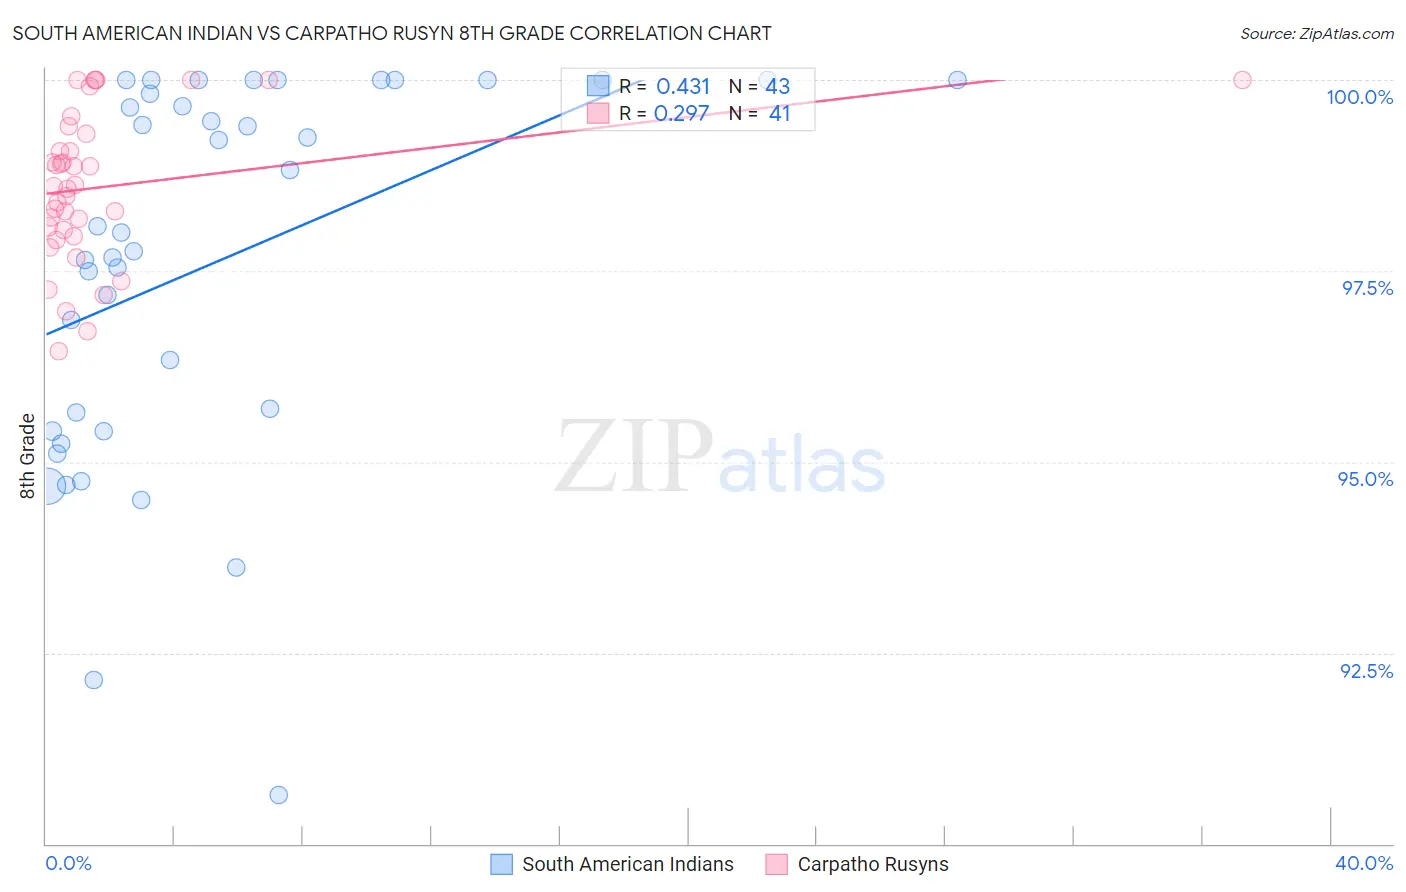
South American Indian vs Carpatho Rusyn 8th Grade Correlation Chart
The statistical analysis conducted on geographies consisting of 164,573,401 people shows a moderate positive correlation between the proportion of South American Indians and percentage of population with at least 8th grade education in the United States with a correlation coefficient (R) of 0.431 and weighted average of 95.1%. Similarly, the statistical analysis conducted on geographies consisting of 10,071,463 people shows a weak positive correlation between the proportion of Carpatho Rusyns and percentage of population with at least 8th grade education in the United States with a correlation coefficient (R) of 0.297 and weighted average of 98.1%, a difference of 3.2%.
8th Grade Correlation Summary
| Measurement | South American Indian | Carpatho Rusyn |
| Minimum | 90.6% | 96.4% |
| Maximum | 100.0% | 100.0% |
| Range | 9.4% | 3.6% |
| Mean | 97.6% | 98.6% |
| Median | 98.0% | 98.6% |
| Interquartile 25% (IQ1) | 95.4% | 98.0% |
| Interquartile 75% (IQ3) | 100.0% | 99.3% |
| Interquartile Range (IQR) | 4.6% | 1.4% |
| Standard Deviation (Sample) | 2.5% | 0.98% |
| Standard Deviation (Population) | 2.4% | 0.97% |
Similar Demographics by 8th Grade
Demographics Similar to South American Indians by 8th Grade
In terms of 8th grade, the demographic groups most similar to South American Indians are Immigrants from Sierra Leone (95.1%, a difference of 0.010%), Ethiopian (95.1%, a difference of 0.010%), Tongan (95.1%, a difference of 0.020%), Paiute (95.1%, a difference of 0.020%), and Immigrants from Middle Africa (95.1%, a difference of 0.020%).
| Demographics | Rating | Rank | 8th Grade |
| Costa Ricans | 3.0 /100 | #234 | Tragic 95.2% |
| Nigerians | 2.9 /100 | #235 | Tragic 95.2% |
| Senegalese | 2.7 /100 | #236 | Tragic 95.2% |
| Immigrants | Africa | 2.7 /100 | #237 | Tragic 95.2% |
| Natives/Alaskans | 2.3 /100 | #238 | Tragic 95.2% |
| Immigrants | Sierra Leone | 2.1 /100 | #239 | Tragic 95.1% |
| Ethiopians | 2.0 /100 | #240 | Tragic 95.1% |
| South American Indians | 1.9 /100 | #241 | Tragic 95.1% |
| Tongans | 1.7 /100 | #242 | Tragic 95.1% |
| Paiute | 1.7 /100 | #243 | Tragic 95.1% |
| Immigrants | Middle Africa | 1.7 /100 | #244 | Tragic 95.1% |
| Jamaicans | 1.4 /100 | #245 | Tragic 95.1% |
| Somalis | 1.4 /100 | #246 | Tragic 95.1% |
| Immigrants | Senegal | 1.4 /100 | #247 | Tragic 95.1% |
| Uruguayans | 1.2 /100 | #248 | Tragic 95.1% |
Demographics Similar to Carpatho Rusyns by 8th Grade
In terms of 8th grade, the demographic groups most similar to Carpatho Rusyns are Ottawa (97.9%, a difference of 0.20%), Finnish (98.4%, a difference of 0.23%), Dutch (97.7%, a difference of 0.49%), Norwegian (97.6%, a difference of 0.55%), and Slovak (97.6%, a difference of 0.59%).
| Demographics | Rating | Rank | 8th Grade |
| Crow | 100.0 /100 | #1 | Exceptional 99.0% |
| Tsimshian | 100.0 /100 | #2 | Exceptional 99.0% |
| Finns | 100.0 /100 | #3 | Exceptional 98.4% |
| Carpatho Rusyns | 100.0 /100 | #4 | Exceptional 98.1% |
| Ottawa | 100.0 /100 | #5 | Exceptional 97.9% |
| Dutch | 100.0 /100 | #6 | Exceptional 97.7% |
| Norwegians | 100.0 /100 | #7 | Exceptional 97.6% |
| Slovaks | 100.0 /100 | #8 | Exceptional 97.6% |
| Germans | 100.0 /100 | #9 | Exceptional 97.5% |
| Slovenes | 100.0 /100 | #10 | Exceptional 97.5% |
| Poles | 100.0 /100 | #11 | Exceptional 97.4% |
| Swedes | 100.0 /100 | #12 | Exceptional 97.4% |
| Alaskan Athabascans | 100.0 /100 | #13 | Exceptional 97.3% |
| English | 100.0 /100 | #14 | Exceptional 97.3% |
| Pennsylvania Germans | 100.0 /100 | #15 | Exceptional 97.3% |