South American Indian vs European 8th Grade
COMPARE
South American Indian
European
8th Grade
8th Grade Comparison
South American Indians
Europeans
95.1%
8TH GRADE
1.9/ 100
METRIC RATING
241st/ 347
METRIC RANK
97.1%
8TH GRADE
100.0/ 100
METRIC RATING
29th/ 347
METRIC RANK
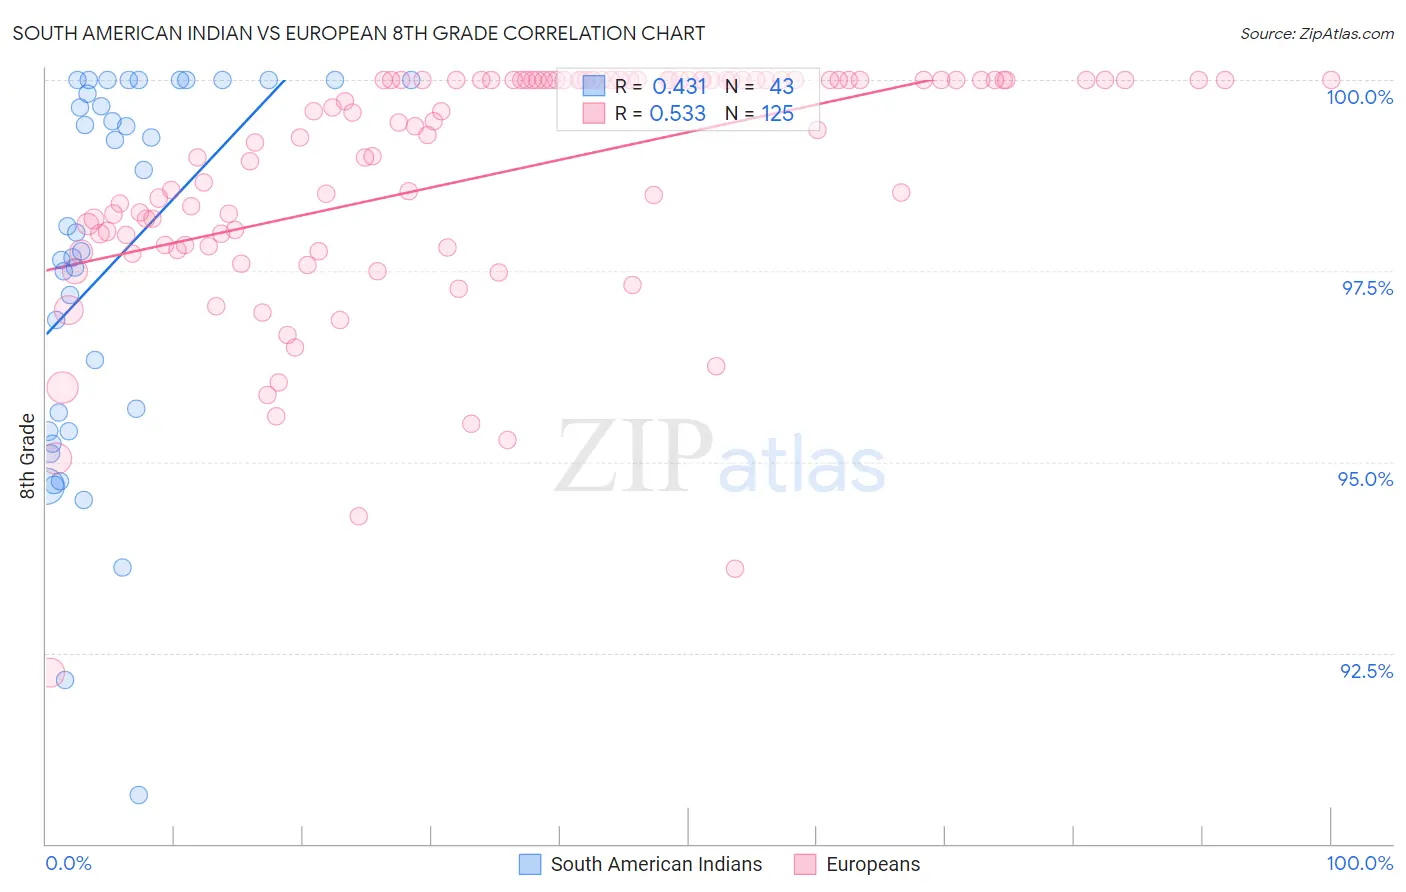
South American Indian vs European 8th Grade Correlation Chart
The statistical analysis conducted on geographies consisting of 164,573,401 people shows a moderate positive correlation between the proportion of South American Indians and percentage of population with at least 8th grade education in the United States with a correlation coefficient (R) of 0.431 and weighted average of 95.1%. Similarly, the statistical analysis conducted on geographies consisting of 561,829,544 people shows a substantial positive correlation between the proportion of Europeans and percentage of population with at least 8th grade education in the United States with a correlation coefficient (R) of 0.533 and weighted average of 97.1%, a difference of 2.1%.
8th Grade Correlation Summary
| Measurement | South American Indian | European |
| Minimum | 90.6% | 92.2% |
| Maximum | 100.0% | 100.0% |
| Range | 9.4% | 7.8% |
| Mean | 97.6% | 98.8% |
| Median | 98.0% | 99.4% |
| Interquartile 25% (IQ1) | 95.4% | 97.8% |
| Interquartile 75% (IQ3) | 100.0% | 100.0% |
| Interquartile Range (IQR) | 4.6% | 2.2% |
| Standard Deviation (Sample) | 2.5% | 1.6% |
| Standard Deviation (Population) | 2.4% | 1.6% |
Similar Demographics by 8th Grade
Demographics Similar to South American Indians by 8th Grade
In terms of 8th grade, the demographic groups most similar to South American Indians are Immigrants from Sierra Leone (95.1%, a difference of 0.010%), Ethiopian (95.1%, a difference of 0.010%), Tongan (95.1%, a difference of 0.020%), Paiute (95.1%, a difference of 0.020%), and Immigrants from Middle Africa (95.1%, a difference of 0.020%).
| Demographics | Rating | Rank | 8th Grade |
| Costa Ricans | 3.0 /100 | #234 | Tragic 95.2% |
| Nigerians | 2.9 /100 | #235 | Tragic 95.2% |
| Senegalese | 2.7 /100 | #236 | Tragic 95.2% |
| Immigrants | Africa | 2.7 /100 | #237 | Tragic 95.2% |
| Natives/Alaskans | 2.3 /100 | #238 | Tragic 95.2% |
| Immigrants | Sierra Leone | 2.1 /100 | #239 | Tragic 95.1% |
| Ethiopians | 2.0 /100 | #240 | Tragic 95.1% |
| South American Indians | 1.9 /100 | #241 | Tragic 95.1% |
| Tongans | 1.7 /100 | #242 | Tragic 95.1% |
| Paiute | 1.7 /100 | #243 | Tragic 95.1% |
| Immigrants | Middle Africa | 1.7 /100 | #244 | Tragic 95.1% |
| Jamaicans | 1.4 /100 | #245 | Tragic 95.1% |
| Somalis | 1.4 /100 | #246 | Tragic 95.1% |
| Immigrants | Senegal | 1.4 /100 | #247 | Tragic 95.1% |
| Uruguayans | 1.2 /100 | #248 | Tragic 95.1% |
Demographics Similar to Europeans by 8th Grade
In terms of 8th grade, the demographic groups most similar to Europeans are Italian (97.1%, a difference of 0.0%), Scotch-Irish (97.1%, a difference of 0.010%), Czech (97.1%, a difference of 0.030%), French (97.1%, a difference of 0.030%), and Sioux (97.1%, a difference of 0.030%).
| Demographics | Rating | Rank | 8th Grade |
| Welsh | 100.0 /100 | #22 | Exceptional 97.2% |
| French Canadians | 100.0 /100 | #23 | Exceptional 97.2% |
| Scandinavians | 100.0 /100 | #24 | Exceptional 97.2% |
| Czechs | 100.0 /100 | #25 | Exceptional 97.1% |
| French | 100.0 /100 | #26 | Exceptional 97.1% |
| Scotch-Irish | 100.0 /100 | #27 | Exceptional 97.1% |
| Italians | 100.0 /100 | #28 | Exceptional 97.1% |
| Europeans | 100.0 /100 | #29 | Exceptional 97.1% |
| Sioux | 100.0 /100 | #30 | Exceptional 97.1% |
| Chippewa | 100.0 /100 | #31 | Exceptional 97.1% |
| Yup'ik | 100.0 /100 | #32 | Exceptional 97.0% |
| Swiss | 100.0 /100 | #33 | Exceptional 97.0% |
| Luxembourgers | 100.0 /100 | #34 | Exceptional 97.0% |
| Alaska Natives | 100.0 /100 | #35 | Exceptional 97.0% |
| Belgians | 100.0 /100 | #36 | Exceptional 97.0% |