Iraqi vs Delaware 10th Grade
COMPARE
Iraqi
Delaware
10th Grade
10th Grade Comparison
Iraqis
Delaware
93.9%
10TH GRADE
68.1/ 100
METRIC RATING
164th/ 347
METRIC RANK
94.4%
10TH GRADE
96.3/ 100
METRIC RATING
115th/ 347
METRIC RANK
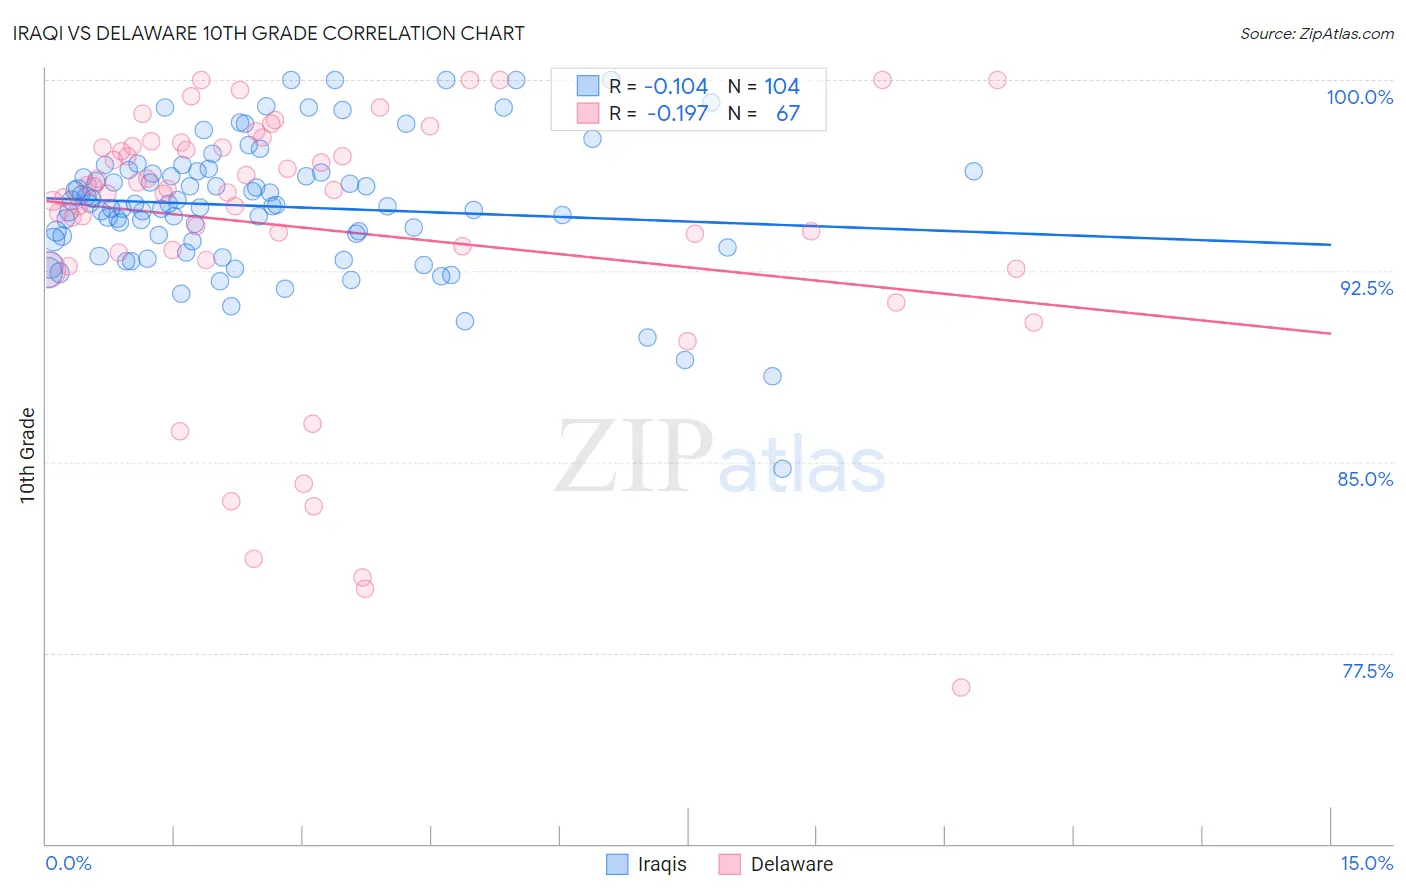
Iraqi vs Delaware 10th Grade Correlation Chart
The statistical analysis conducted on geographies consisting of 170,595,168 people shows a poor negative correlation between the proportion of Iraqis and percentage of population with at least 10th grade education in the United States with a correlation coefficient (R) of -0.104 and weighted average of 93.9%. Similarly, the statistical analysis conducted on geographies consisting of 96,234,866 people shows a poor negative correlation between the proportion of Delaware and percentage of population with at least 10th grade education in the United States with a correlation coefficient (R) of -0.197 and weighted average of 94.4%, a difference of 0.56%.
10th Grade Correlation Summary
| Measurement | Iraqi | Delaware |
| Minimum | 84.7% | 76.1% |
| Maximum | 100.0% | 100.0% |
| Range | 15.3% | 23.9% |
| Mean | 95.0% | 94.2% |
| Median | 95.1% | 95.7% |
| Interquartile 25% (IQ1) | 93.7% | 93.2% |
| Interquartile 75% (IQ3) | 96.4% | 97.4% |
| Interquartile Range (IQR) | 2.7% | 4.2% |
| Standard Deviation (Sample) | 2.6% | 5.3% |
| Standard Deviation (Population) | 2.6% | 5.3% |
Similar Demographics by 10th Grade
Demographics Similar to Iraqis by 10th Grade
In terms of 10th grade, the demographic groups most similar to Iraqis are Venezuelan (93.9%, a difference of 0.010%), Chilean (93.9%, a difference of 0.020%), Pakistani (93.9%, a difference of 0.020%), Assyrian/Chaldean/Syriac (93.9%, a difference of 0.020%), and Immigrants from Poland (93.9%, a difference of 0.020%).
| Demographics | Rating | Rank | 10th Grade |
| Kiowa | 73.3 /100 | #157 | Good 93.9% |
| Bermudans | 71.0 /100 | #158 | Good 93.9% |
| Chileans | 70.2 /100 | #159 | Good 93.9% |
| Pakistanis | 70.1 /100 | #160 | Good 93.9% |
| Assyrians/Chaldeans/Syriacs | 69.7 /100 | #161 | Good 93.9% |
| Immigrants | Poland | 69.6 /100 | #162 | Good 93.9% |
| Venezuelans | 69.5 /100 | #163 | Good 93.9% |
| Iraqis | 68.1 /100 | #164 | Good 93.9% |
| Brazilians | 63.6 /100 | #165 | Good 93.8% |
| Immigrants | Iraq | 63.0 /100 | #166 | Good 93.8% |
| Immigrants | Egypt | 62.3 /100 | #167 | Good 93.8% |
| Alsatians | 59.4 /100 | #168 | Average 93.8% |
| Immigrants | Spain | 55.9 /100 | #169 | Average 93.8% |
| Immigrants | Venezuela | 53.9 /100 | #170 | Average 93.8% |
| Immigrants | Albania | 52.4 /100 | #171 | Average 93.8% |
Demographics Similar to Delaware by 10th Grade
In terms of 10th grade, the demographic groups most similar to Delaware are German Russian (94.4%, a difference of 0.0%), Sioux (94.4%, a difference of 0.0%), Palestinian (94.4%, a difference of 0.020%), Immigrants from Kuwait (94.4%, a difference of 0.030%), and Immigrants from Hungary (94.4%, a difference of 0.030%).
| Demographics | Rating | Rank | 10th Grade |
| Immigrants | North Macedonia | 97.2 /100 | #108 | Exceptional 94.5% |
| Immigrants | Norway | 97.2 /100 | #109 | Exceptional 94.5% |
| Burmese | 97.1 /100 | #110 | Exceptional 94.5% |
| Immigrants | Zimbabwe | 96.8 /100 | #111 | Exceptional 94.4% |
| Immigrants | Kuwait | 96.8 /100 | #112 | Exceptional 94.4% |
| Palestinians | 96.5 /100 | #113 | Exceptional 94.4% |
| German Russians | 96.3 /100 | #114 | Exceptional 94.4% |
| Delaware | 96.3 /100 | #115 | Exceptional 94.4% |
| Sioux | 96.2 /100 | #116 | Exceptional 94.4% |
| Immigrants | Hungary | 95.8 /100 | #117 | Exceptional 94.4% |
| Jordanians | 95.6 /100 | #118 | Exceptional 94.4% |
| Immigrants | Israel | 95.4 /100 | #119 | Exceptional 94.4% |
| Immigrants | Taiwan | 95.3 /100 | #120 | Exceptional 94.4% |
| Immigrants | Belarus | 95.2 /100 | #121 | Exceptional 94.4% |
| Inupiat | 95.1 /100 | #122 | Exceptional 94.4% |