South American Indian vs Carpatho Rusyn Average Family Size
COMPARE
South American Indian
Carpatho Rusyn
Average Family Size
Average Family Size Comparison
South American Indians
Carpatho Rusyns
3.26
AVERAGE FAMILY SIZE
91.6/ 100
METRIC RATING
124th/ 347
METRIC RANK
3.06
AVERAGE FAMILY SIZE
0.0/ 100
METRIC RATING
347th/ 347
METRIC RANK
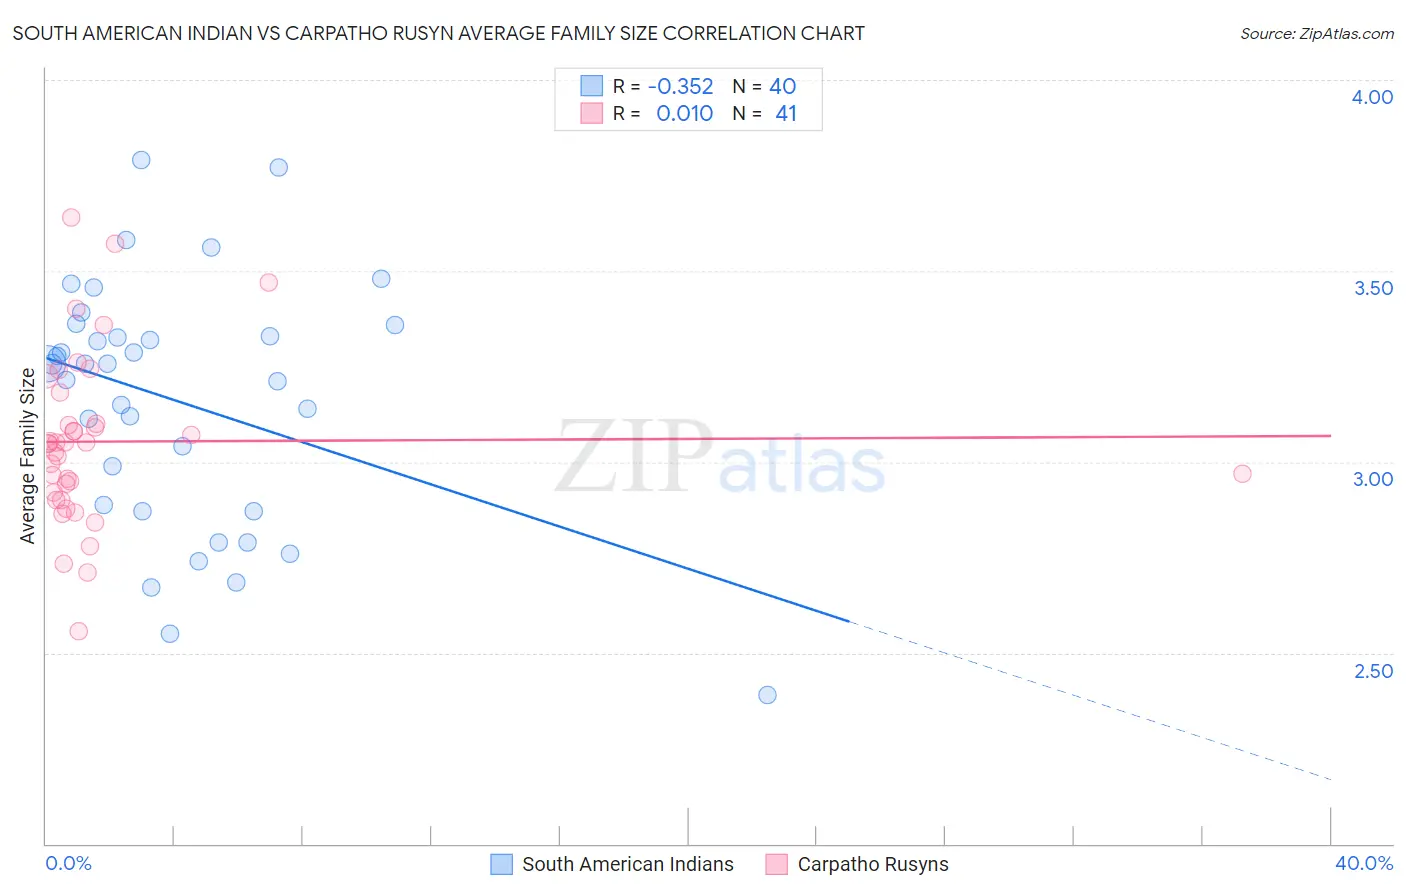
South American Indian vs Carpatho Rusyn Average Family Size Correlation Chart
The statistical analysis conducted on geographies consisting of 164,540,094 people shows a mild negative correlation between the proportion of South American Indians and average family size in the United States with a correlation coefficient (R) of -0.352 and weighted average of 3.26. Similarly, the statistical analysis conducted on geographies consisting of 58,871,605 people shows no correlation between the proportion of Carpatho Rusyns and average family size in the United States with a correlation coefficient (R) of 0.010 and weighted average of 3.06, a difference of 6.6%.
Average Family Size Correlation Summary
| Measurement | South American Indian | Carpatho Rusyn |
| Minimum | 2.39 | 2.56 |
| Maximum | 3.79 | 3.64 |
| Range | 1.40 | 1.08 |
| Mean | 3.16 | 3.05 |
| Median | 3.26 | 3.05 |
| Interquartile 25% (IQ1) | 2.88 | 2.91 |
| Interquartile 75% (IQ3) | 3.35 | 3.14 |
| Interquartile Range (IQR) | 0.47 | 0.23 |
| Standard Deviation (Sample) | 0.32 | 0.22 |
| Standard Deviation (Population) | 0.32 | 0.22 |
Similar Demographics by Average Family Size
Demographics Similar to South American Indians by Average Family Size
In terms of average family size, the demographic groups most similar to South American Indians are Immigrants from Cuba (3.26, a difference of 0.020%), Alaskan Athabascan (3.27, a difference of 0.050%), Immigrants from Costa Rica (3.26, a difference of 0.050%), Immigrants from Syria (3.26, a difference of 0.060%), and Immigrants from Colombia (3.27, a difference of 0.070%).
| Demographics | Rating | Rank | Average Family Size |
| Kiowa | 94.8 /100 | #117 | Exceptional 3.27 |
| Immigrants | Asia | 94.0 /100 | #118 | Exceptional 3.27 |
| Immigrants | Indonesia | 93.7 /100 | #119 | Exceptional 3.27 |
| Immigrants | Bahamas | 93.6 /100 | #120 | Exceptional 3.27 |
| Immigrants | Thailand | 93.3 /100 | #121 | Exceptional 3.27 |
| Immigrants | Colombia | 92.8 /100 | #122 | Exceptional 3.27 |
| Alaskan Athabascans | 92.4 /100 | #123 | Exceptional 3.27 |
| South American Indians | 91.6 /100 | #124 | Exceptional 3.26 |
| Immigrants | Cuba | 91.3 /100 | #125 | Exceptional 3.26 |
| Immigrants | Costa Rica | 90.7 /100 | #126 | Exceptional 3.26 |
| Immigrants | Syria | 90.6 /100 | #127 | Exceptional 3.26 |
| Colombians | 89.9 /100 | #128 | Excellent 3.26 |
| Immigrants | Hong Kong | 88.6 /100 | #129 | Excellent 3.26 |
| Laotians | 88.5 /100 | #130 | Excellent 3.26 |
| Immigrants | Western Asia | 87.7 /100 | #131 | Excellent 3.26 |
Demographics Similar to Carpatho Rusyns by Average Family Size
In terms of average family size, the demographic groups most similar to Carpatho Rusyns are Slovak (3.06, a difference of 0.060%), Slovene (3.07, a difference of 0.35%), French Canadian (3.07, a difference of 0.39%), Norwegian (3.08, a difference of 0.63%), and German (3.09, a difference of 0.86%).
| Demographics | Rating | Rank | Average Family Size |
| Estonians | 0.0 /100 | #333 | Tragic 3.10 |
| Lithuanians | 0.0 /100 | #334 | Tragic 3.10 |
| Luxembourgers | 0.0 /100 | #335 | Tragic 3.10 |
| Irish | 0.0 /100 | #336 | Tragic 3.10 |
| Swedes | 0.0 /100 | #337 | Tragic 3.10 |
| French | 0.0 /100 | #338 | Tragic 3.10 |
| Croatians | 0.0 /100 | #339 | Tragic 3.10 |
| Finns | 0.0 /100 | #340 | Tragic 3.09 |
| Poles | 0.0 /100 | #341 | Tragic 3.09 |
| Germans | 0.0 /100 | #342 | Tragic 3.09 |
| Norwegians | 0.0 /100 | #343 | Tragic 3.08 |
| French Canadians | 0.0 /100 | #344 | Tragic 3.07 |
| Slovenes | 0.0 /100 | #345 | Tragic 3.07 |
| Slovaks | 0.0 /100 | #346 | Tragic 3.06 |
| Carpatho Rusyns | 0.0 /100 | #347 | Tragic 3.06 |