South African vs Slovak 10th Grade
COMPARE
South African
Slovak
10th Grade
10th Grade Comparison
South Africans
Slovaks
94.7%
10TH GRADE
98.8/ 100
METRIC RATING
90th/ 347
METRIC RANK
96.0%
10TH GRADE
100.0/ 100
METRIC RATING
2nd/ 347
METRIC RANK
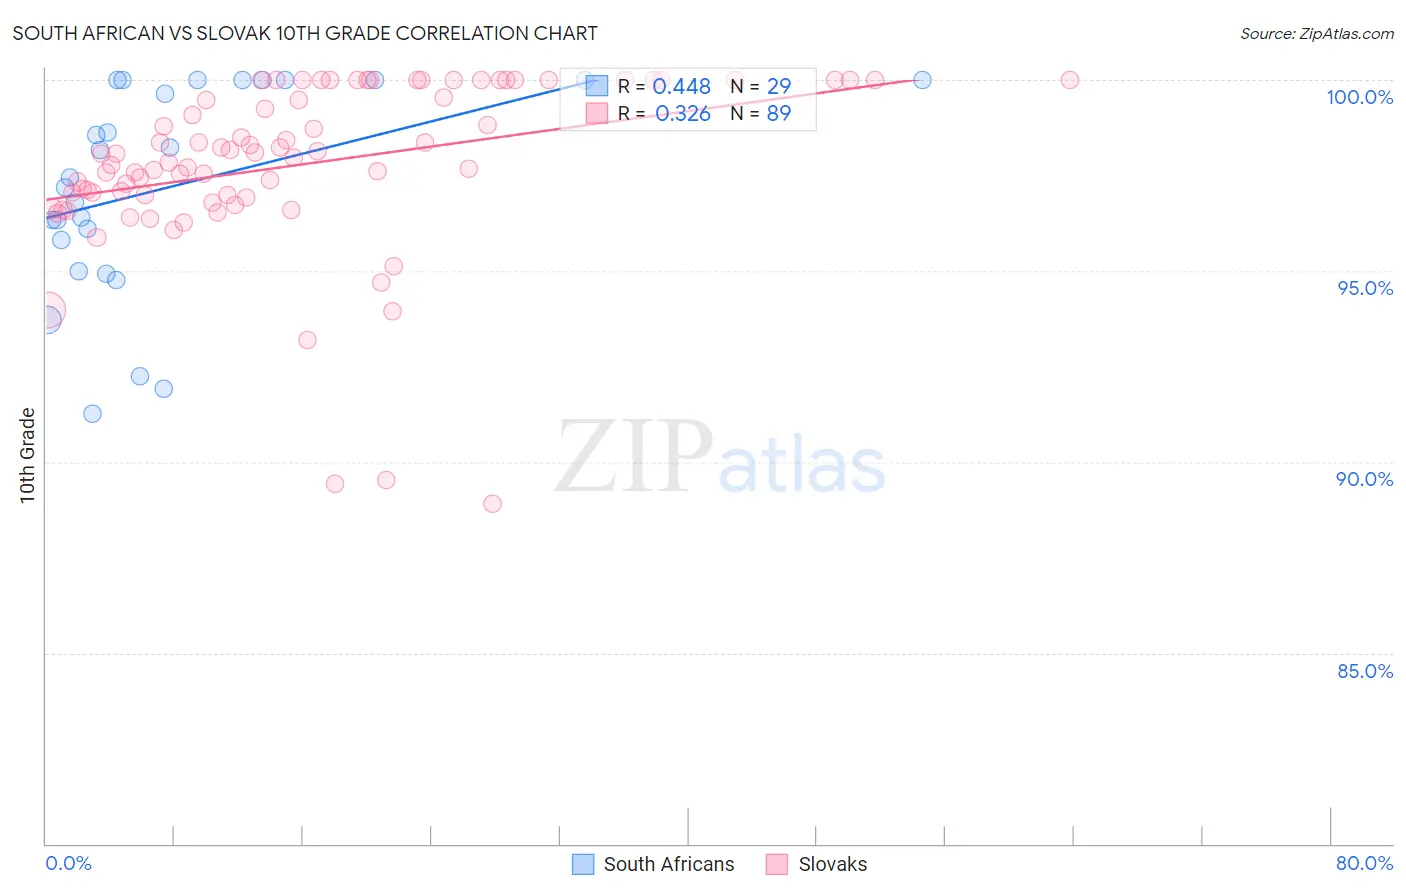
South African vs Slovak 10th Grade Correlation Chart
The statistical analysis conducted on geographies consisting of 182,604,532 people shows a moderate positive correlation between the proportion of South Africans and percentage of population with at least 10th grade education in the United States with a correlation coefficient (R) of 0.448 and weighted average of 94.7%. Similarly, the statistical analysis conducted on geographies consisting of 397,891,887 people shows a mild positive correlation between the proportion of Slovaks and percentage of population with at least 10th grade education in the United States with a correlation coefficient (R) of 0.326 and weighted average of 96.0%, a difference of 1.5%.
10th Grade Correlation Summary
| Measurement | South African | Slovak |
| Minimum | 91.3% | 88.9% |
| Maximum | 100.0% | 100.0% |
| Range | 8.7% | 11.1% |
| Mean | 97.2% | 97.8% |
| Median | 97.5% | 98.1% |
| Interquartile 25% (IQ1) | 95.4% | 97.0% |
| Interquartile 75% (IQ3) | 100.0% | 100.0% |
| Interquartile Range (IQR) | 4.6% | 3.0% |
| Standard Deviation (Sample) | 2.7% | 2.3% |
| Standard Deviation (Population) | 2.6% | 2.2% |
Similar Demographics by 10th Grade
Demographics Similar to South Africans by 10th Grade
In terms of 10th grade, the demographic groups most similar to South Africans are Immigrants from Moldova (94.7%, a difference of 0.010%), White/Caucasian (94.7%, a difference of 0.010%), Immigrants from Japan (94.7%, a difference of 0.020%), Immigrants from Saudi Arabia (94.7%, a difference of 0.030%), and Crow (94.7%, a difference of 0.040%).
| Demographics | Rating | Rank | 10th Grade |
| Immigrants | Western Europe | 99.1 /100 | #83 | Exceptional 94.7% |
| Icelanders | 99.1 /100 | #84 | Exceptional 94.7% |
| Crow | 99.0 /100 | #85 | Exceptional 94.7% |
| Puget Sound Salish | 99.0 /100 | #86 | Exceptional 94.7% |
| Immigrants | Saudi Arabia | 99.0 /100 | #87 | Exceptional 94.7% |
| Immigrants | Japan | 99.0 /100 | #88 | Exceptional 94.7% |
| Immigrants | Moldova | 98.9 /100 | #89 | Exceptional 94.7% |
| South Africans | 98.8 /100 | #90 | Exceptional 94.7% |
| Whites/Caucasians | 98.8 /100 | #91 | Exceptional 94.7% |
| Yugoslavians | 98.4 /100 | #92 | Exceptional 94.6% |
| Soviet Union | 98.3 /100 | #93 | Exceptional 94.6% |
| Immigrants | Germany | 98.3 /100 | #94 | Exceptional 94.6% |
| Menominee | 98.3 /100 | #95 | Exceptional 94.6% |
| Immigrants | Switzerland | 98.3 /100 | #96 | Exceptional 94.6% |
| Lebanese | 98.3 /100 | #97 | Exceptional 94.6% |
Demographics Similar to Slovaks by 10th Grade
In terms of 10th grade, the demographic groups most similar to Slovaks are Slovene (95.9%, a difference of 0.10%), Swedish (95.9%, a difference of 0.10%), Carpatho Rusyn (95.9%, a difference of 0.12%), Norwegian (96.2%, a difference of 0.13%), and Polish (95.8%, a difference of 0.23%).
| Demographics | Rating | Rank | 10th Grade |
| Norwegians | 100.0 /100 | #1 | Exceptional 96.2% |
| Slovaks | 100.0 /100 | #2 | Exceptional 96.0% |
| Slovenes | 100.0 /100 | #3 | Exceptional 95.9% |
| Swedes | 100.0 /100 | #4 | Exceptional 95.9% |
| Carpatho Rusyns | 100.0 /100 | #5 | Exceptional 95.9% |
| Poles | 100.0 /100 | #6 | Exceptional 95.8% |
| Germans | 100.0 /100 | #7 | Exceptional 95.8% |
| Lithuanians | 100.0 /100 | #8 | Exceptional 95.8% |
| Finns | 100.0 /100 | #9 | Exceptional 95.8% |
| Croatians | 100.0 /100 | #10 | Exceptional 95.7% |
| Danes | 100.0 /100 | #11 | Exceptional 95.7% |
| Tlingit-Haida | 100.0 /100 | #12 | Exceptional 95.7% |
| English | 100.0 /100 | #13 | Exceptional 95.6% |
| Tsimshian | 100.0 /100 | #14 | Exceptional 95.6% |
| Irish | 100.0 /100 | #15 | Exceptional 95.6% |