South African vs Immigrants from Croatia Bachelor's Degree
COMPARE
South African
Immigrants from Croatia
Bachelor's Degree
Bachelor's Degree Comparison
South Africans
Immigrants from Croatia
43.6%
BACHELOR'S DEGREE
99.8/ 100
METRIC RATING
61st/ 347
METRIC RANK
42.3%
BACHELOR'S DEGREE
99.2/ 100
METRIC RATING
80th/ 347
METRIC RANK
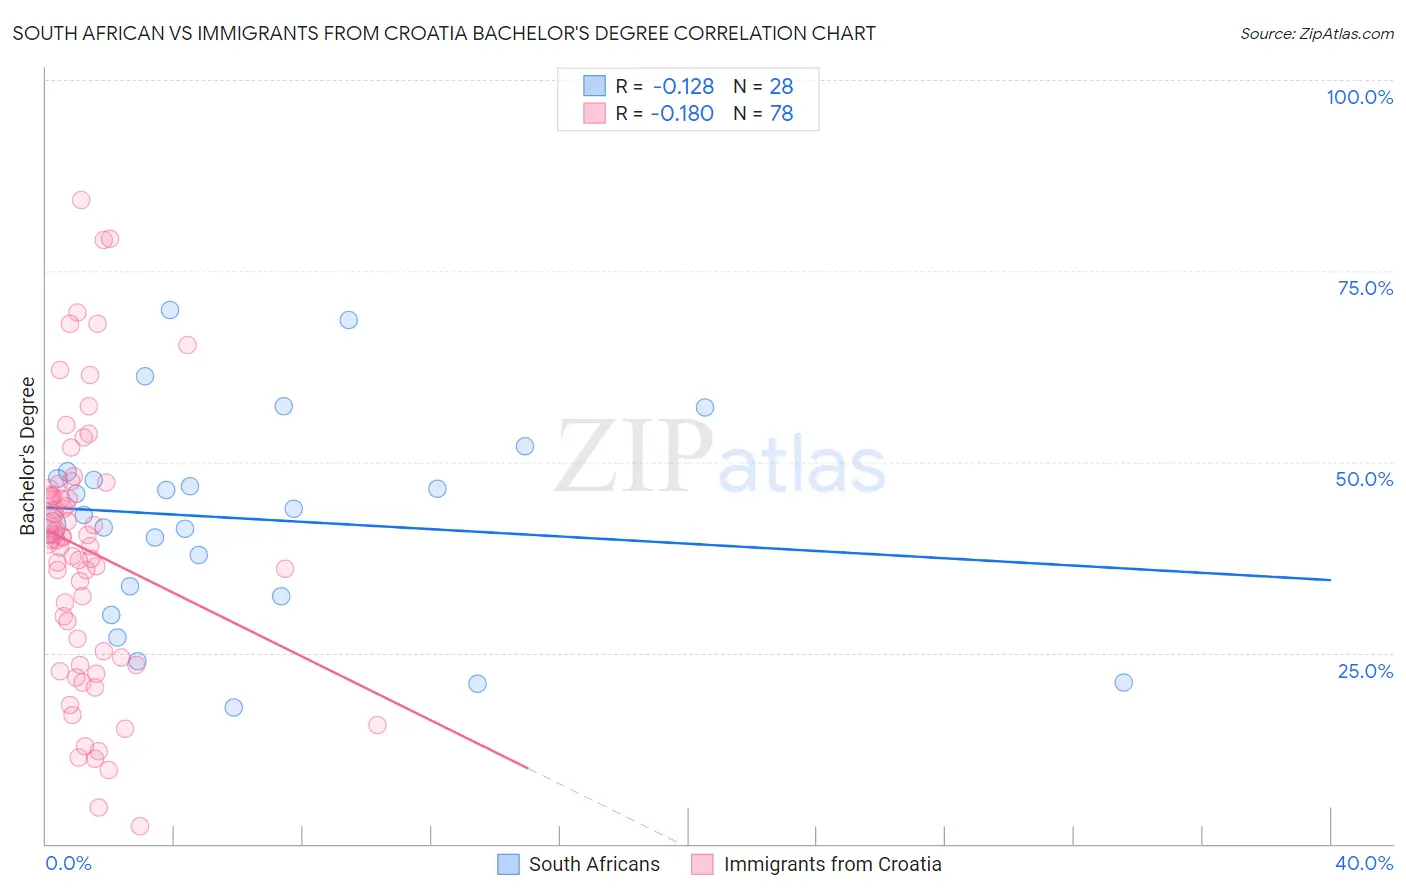
South African vs Immigrants from Croatia Bachelor's Degree Correlation Chart
The statistical analysis conducted on geographies consisting of 182,590,093 people shows a poor negative correlation between the proportion of South Africans and percentage of population with at least bachelor's degree education in the United States with a correlation coefficient (R) of -0.128 and weighted average of 43.6%. Similarly, the statistical analysis conducted on geographies consisting of 132,578,161 people shows a poor negative correlation between the proportion of Immigrants from Croatia and percentage of population with at least bachelor's degree education in the United States with a correlation coefficient (R) of -0.180 and weighted average of 42.3%, a difference of 2.9%.
Bachelor's Degree Correlation Summary
| Measurement | South African | Immigrants from Croatia |
| Minimum | 17.8% | 2.2% |
| Maximum | 69.9% | 84.3% |
| Range | 52.1% | 82.1% |
| Mean | 42.6% | 38.6% |
| Median | 43.4% | 39.9% |
| Interquartile 25% (IQ1) | 33.1% | 25.2% |
| Interquartile 75% (IQ3) | 48.3% | 45.6% |
| Interquartile Range (IQR) | 15.2% | 20.4% |
| Standard Deviation (Sample) | 13.5% | 17.2% |
| Standard Deviation (Population) | 13.3% | 17.1% |
Demographics Similar to South Africans and Immigrants from Croatia by Bachelor's Degree
In terms of bachelor's degree, the demographic groups most similar to South Africans are Immigrants from Kazakhstan (43.4%, a difference of 0.30%), Immigrants from Europe (43.4%, a difference of 0.34%), Argentinean (43.3%, a difference of 0.62%), Zimbabwean (43.3%, a difference of 0.62%), and Immigrants from Netherlands (43.3%, a difference of 0.64%). Similarly, the demographic groups most similar to Immigrants from Croatia are Immigrants from Lebanon (42.4%, a difference of 0.20%), Immigrants from Ethiopia (42.5%, a difference of 0.36%), Immigrants from Eastern Europe (42.5%, a difference of 0.43%), Immigrants from Egypt (42.6%, a difference of 0.60%), and Immigrants from Zimbabwe (42.6%, a difference of 0.62%).
| Demographics | Rating | Rank | Bachelor's Degree |
| New Zealanders | 99.9 /100 | #60 | Exceptional 44.0% |
| South Africans | 99.8 /100 | #61 | Exceptional 43.6% |
| Immigrants | Kazakhstan | 99.8 /100 | #62 | Exceptional 43.4% |
| Immigrants | Europe | 99.8 /100 | #63 | Exceptional 43.4% |
| Argentineans | 99.7 /100 | #64 | Exceptional 43.3% |
| Zimbabweans | 99.7 /100 | #65 | Exceptional 43.3% |
| Immigrants | Netherlands | 99.7 /100 | #66 | Exceptional 43.3% |
| Egyptians | 99.7 /100 | #67 | Exceptional 43.3% |
| Immigrants | Indonesia | 99.7 /100 | #68 | Exceptional 43.3% |
| Immigrants | Pakistan | 99.7 /100 | #69 | Exceptional 43.1% |
| Immigrants | Romania | 99.6 /100 | #70 | Exceptional 42.9% |
| Immigrants | Argentina | 99.6 /100 | #71 | Exceptional 42.8% |
| Ethiopians | 99.5 /100 | #72 | Exceptional 42.8% |
| Immigrants | Uzbekistan | 99.5 /100 | #73 | Exceptional 42.8% |
| Bhutanese | 99.5 /100 | #74 | Exceptional 42.7% |
| Immigrants | Zimbabwe | 99.4 /100 | #75 | Exceptional 42.6% |
| Immigrants | Egypt | 99.4 /100 | #76 | Exceptional 42.6% |
| Immigrants | Eastern Europe | 99.4 /100 | #77 | Exceptional 42.5% |
| Immigrants | Ethiopia | 99.4 /100 | #78 | Exceptional 42.5% |
| Immigrants | Lebanon | 99.3 /100 | #79 | Exceptional 42.4% |
| Immigrants | Croatia | 99.2 /100 | #80 | Exceptional 42.3% |