Somali vs Immigrants from Syria High School Diploma
COMPARE
Somali
Immigrants from Syria
High School Diploma
High School Diploma Comparison
Somalis
Immigrants from Syria
88.6%
HIGH SCHOOL DIPLOMA
17.5/ 100
METRIC RATING
203rd/ 347
METRIC RANK
89.0%
HIGH SCHOOL DIPLOMA
39.2/ 100
METRIC RATING
184th/ 347
METRIC RANK
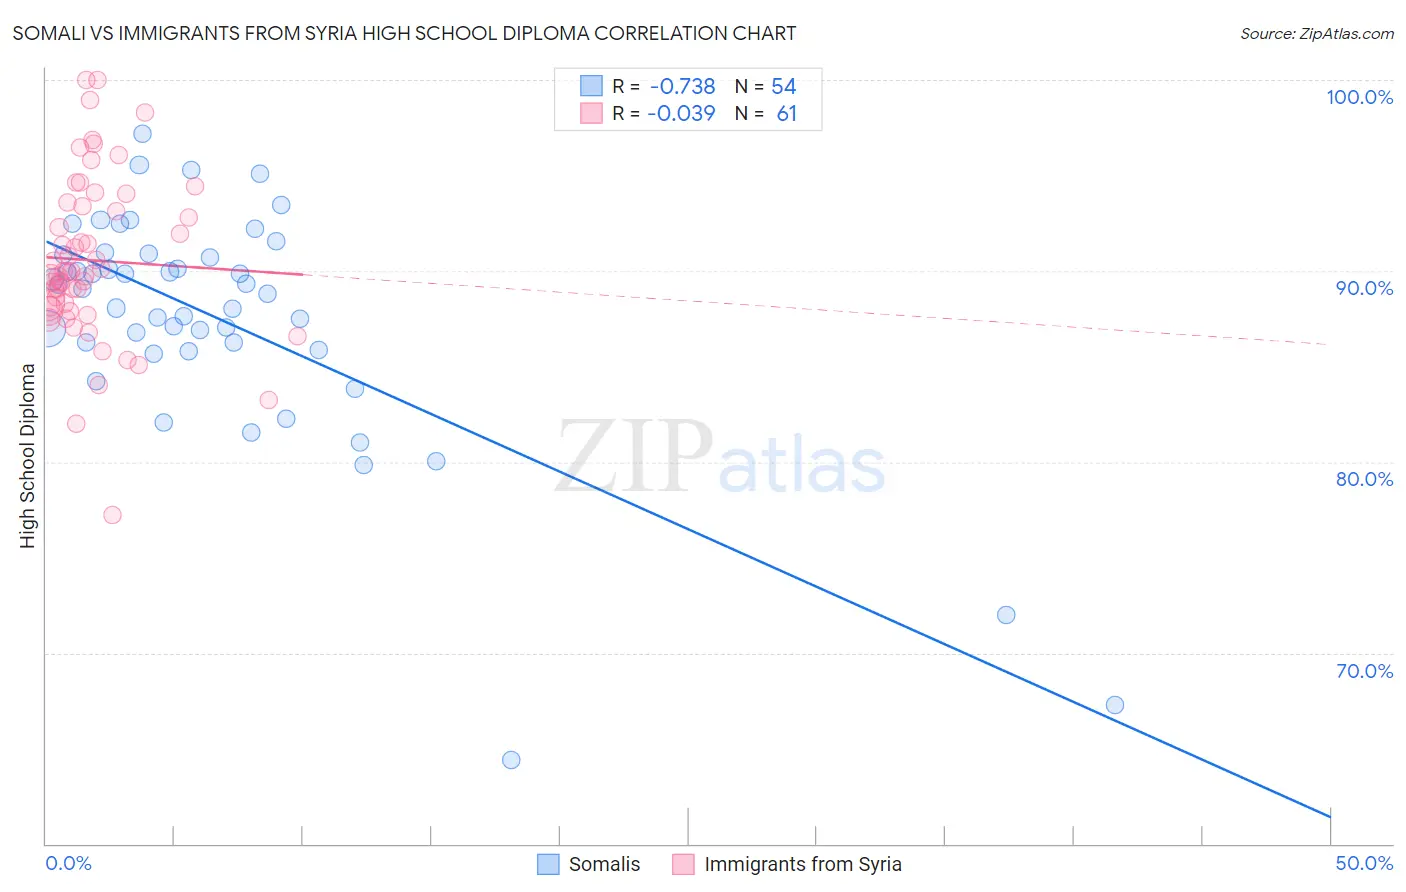
Somali vs Immigrants from Syria High School Diploma Correlation Chart
The statistical analysis conducted on geographies consisting of 99,332,457 people shows a strong negative correlation between the proportion of Somalis and percentage of population with at least high school diploma education in the United States with a correlation coefficient (R) of -0.738 and weighted average of 88.6%. Similarly, the statistical analysis conducted on geographies consisting of 174,108,882 people shows no correlation between the proportion of Immigrants from Syria and percentage of population with at least high school diploma education in the United States with a correlation coefficient (R) of -0.039 and weighted average of 89.0%, a difference of 0.42%.
High School Diploma Correlation Summary
| Measurement | Somali | Immigrants from Syria |
| Minimum | 64.4% | 77.2% |
| Maximum | 97.2% | 100.0% |
| Range | 32.8% | 22.8% |
| Mean | 87.4% | 90.6% |
| Median | 88.9% | 90.0% |
| Interquartile 25% (IQ1) | 85.9% | 88.0% |
| Interquartile 75% (IQ3) | 90.9% | 93.5% |
| Interquartile Range (IQR) | 5.0% | 5.4% |
| Standard Deviation (Sample) | 6.2% | 4.4% |
| Standard Deviation (Population) | 6.1% | 4.3% |
Demographics Similar to Somalis and Immigrants from Syria by High School Diploma
In terms of high school diploma, the demographic groups most similar to Somalis are Panamanian (88.6%, a difference of 0.010%), Hawaiian (88.6%, a difference of 0.020%), Korean (88.6%, a difference of 0.020%), Liberian (88.7%, a difference of 0.030%), and Marshallese (88.6%, a difference of 0.030%). Similarly, the demographic groups most similar to Immigrants from Syria are Ethiopian (89.0%, a difference of 0.040%), Potawatomi (89.0%, a difference of 0.050%), Immigrants from Eastern Africa (88.9%, a difference of 0.060%), Guamanian/Chamorro (88.9%, a difference of 0.060%), and Immigrants from Sudan (88.9%, a difference of 0.090%).
| Demographics | Rating | Rank | High School Diploma |
| Potawatomi | 42.5 /100 | #183 | Average 89.0% |
| Immigrants | Syria | 39.2 /100 | #184 | Fair 89.0% |
| Ethiopians | 37.0 /100 | #185 | Fair 89.0% |
| Immigrants | Eastern Africa | 35.8 /100 | #186 | Fair 88.9% |
| Guamanians/Chamorros | 35.5 /100 | #187 | Fair 88.9% |
| Immigrants | Sudan | 33.4 /100 | #188 | Fair 88.9% |
| Immigrants | Uganda | 32.6 /100 | #189 | Fair 88.9% |
| Immigrants | Chile | 31.9 /100 | #190 | Fair 88.9% |
| Immigrants | Ethiopia | 30.9 /100 | #191 | Fair 88.9% |
| Moroccans | 29.5 /100 | #192 | Fair 88.8% |
| Immigrants | Oceania | 26.9 /100 | #193 | Fair 88.8% |
| Immigrants | Venezuela | 25.8 /100 | #194 | Fair 88.8% |
| Afghans | 23.9 /100 | #195 | Fair 88.8% |
| Immigrants | Southern Europe | 23.4 /100 | #196 | Fair 88.7% |
| French American Indians | 21.5 /100 | #197 | Fair 88.7% |
| Liberians | 18.8 /100 | #198 | Poor 88.7% |
| Marshallese | 18.7 /100 | #199 | Poor 88.6% |
| Hawaiians | 18.3 /100 | #200 | Poor 88.6% |
| Koreans | 18.1 /100 | #201 | Poor 88.6% |
| Panamanians | 18.0 /100 | #202 | Poor 88.6% |
| Somalis | 17.5 /100 | #203 | Poor 88.6% |