Somali vs Immigrants from Saudi Arabia High School Diploma
COMPARE
Somali
Immigrants from Saudi Arabia
High School Diploma
High School Diploma Comparison
Somalis
Immigrants from Saudi Arabia
88.6%
HIGH SCHOOL DIPLOMA
17.5/ 100
METRIC RATING
203rd/ 347
METRIC RANK
90.7%
HIGH SCHOOL DIPLOMA
99.1/ 100
METRIC RATING
84th/ 347
METRIC RANK
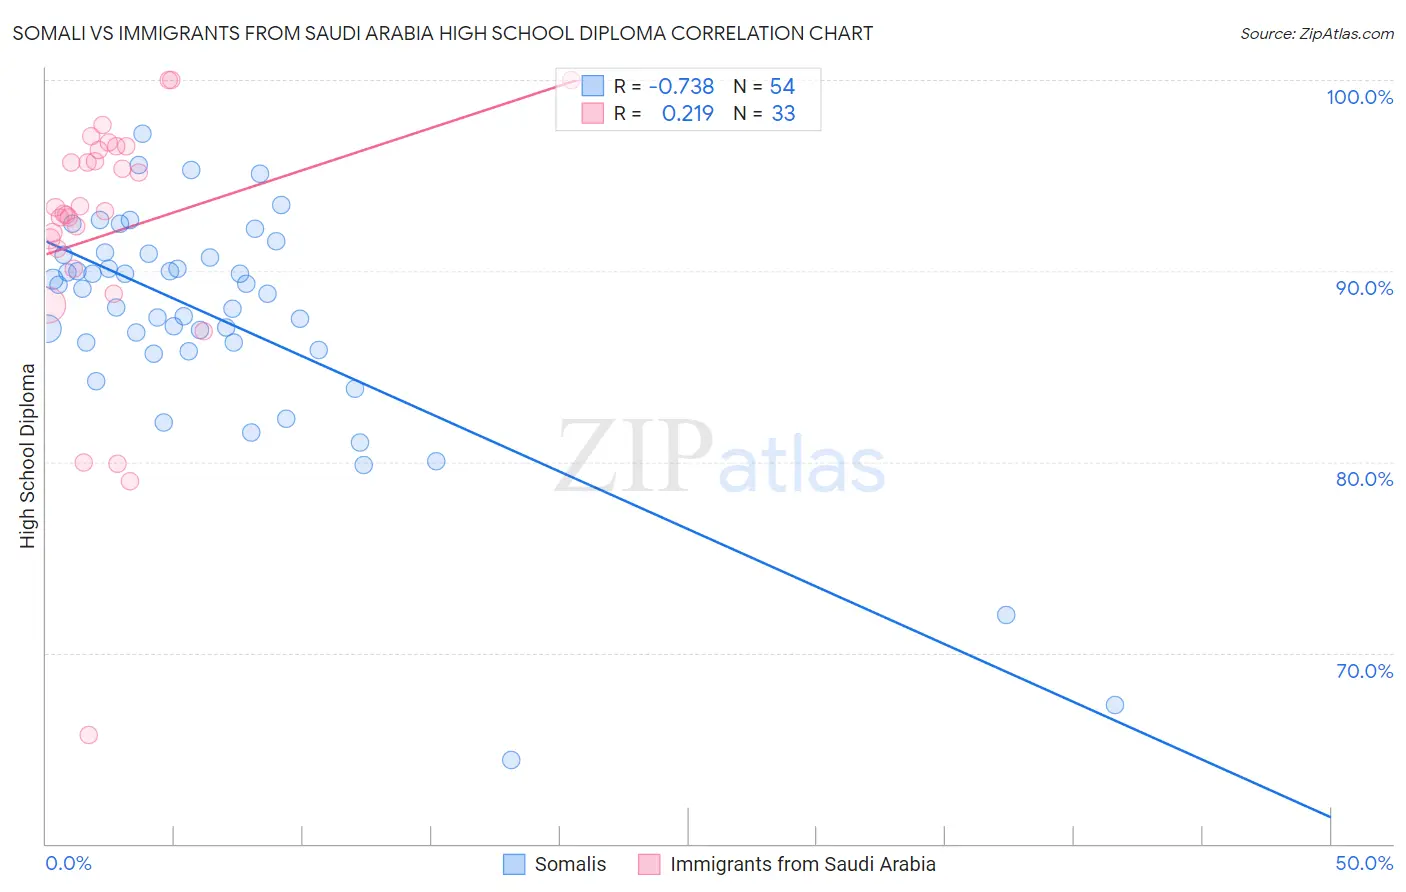
Somali vs Immigrants from Saudi Arabia High School Diploma Correlation Chart
The statistical analysis conducted on geographies consisting of 99,332,457 people shows a strong negative correlation between the proportion of Somalis and percentage of population with at least high school diploma education in the United States with a correlation coefficient (R) of -0.738 and weighted average of 88.6%. Similarly, the statistical analysis conducted on geographies consisting of 164,289,382 people shows a weak positive correlation between the proportion of Immigrants from Saudi Arabia and percentage of population with at least high school diploma education in the United States with a correlation coefficient (R) of 0.219 and weighted average of 90.7%, a difference of 2.4%.
High School Diploma Correlation Summary
| Measurement | Somali | Immigrants from Saudi Arabia |
| Minimum | 64.4% | 65.7% |
| Maximum | 97.2% | 100.0% |
| Range | 32.8% | 34.3% |
| Mean | 87.4% | 92.0% |
| Median | 88.9% | 93.1% |
| Interquartile 25% (IQ1) | 85.9% | 90.7% |
| Interquartile 75% (IQ3) | 90.9% | 96.4% |
| Interquartile Range (IQR) | 5.0% | 5.8% |
| Standard Deviation (Sample) | 6.2% | 7.1% |
| Standard Deviation (Population) | 6.1% | 7.0% |
Similar Demographics by High School Diploma
Demographics Similar to Somalis by High School Diploma
In terms of high school diploma, the demographic groups most similar to Somalis are Panamanian (88.6%, a difference of 0.010%), Armenian (88.6%, a difference of 0.010%), Hawaiian (88.6%, a difference of 0.020%), Korean (88.6%, a difference of 0.020%), and Liberian (88.7%, a difference of 0.030%).
| Demographics | Rating | Rank | High School Diploma |
| Immigrants | Southern Europe | 23.4 /100 | #196 | Fair 88.7% |
| French American Indians | 21.5 /100 | #197 | Fair 88.7% |
| Liberians | 18.8 /100 | #198 | Poor 88.7% |
| Marshallese | 18.7 /100 | #199 | Poor 88.6% |
| Hawaiians | 18.3 /100 | #200 | Poor 88.6% |
| Koreans | 18.1 /100 | #201 | Poor 88.6% |
| Panamanians | 18.0 /100 | #202 | Poor 88.6% |
| Somalis | 17.5 /100 | #203 | Poor 88.6% |
| Armenians | 17.2 /100 | #204 | Poor 88.6% |
| Immigrants | Micronesia | 16.4 /100 | #205 | Poor 88.6% |
| Arapaho | 16.1 /100 | #206 | Poor 88.6% |
| Immigrants | Sierra Leone | 15.8 /100 | #207 | Poor 88.6% |
| Portuguese | 14.4 /100 | #208 | Poor 88.5% |
| Cherokee | 14.3 /100 | #209 | Poor 88.5% |
| Samoans | 14.0 /100 | #210 | Poor 88.5% |
Demographics Similar to Immigrants from Saudi Arabia by High School Diploma
In terms of high school diploma, the demographic groups most similar to Immigrants from Saudi Arabia are Immigrants from Moldova (90.7%, a difference of 0.030%), Scotch-Irish (90.8%, a difference of 0.050%), Romanian (90.7%, a difference of 0.070%), Immigrants from Bulgaria (90.6%, a difference of 0.080%), and Immigrants from England (90.8%, a difference of 0.090%).
| Demographics | Rating | Rank | High School Diploma |
| Native Hawaiians | 99.3 /100 | #77 | Exceptional 90.8% |
| Burmese | 99.3 /100 | #78 | Exceptional 90.8% |
| Immigrants | Denmark | 99.3 /100 | #79 | Exceptional 90.8% |
| Immigrants | England | 99.3 /100 | #80 | Exceptional 90.8% |
| Immigrants | Switzerland | 99.3 /100 | #81 | Exceptional 90.8% |
| Scotch-Irish | 99.2 /100 | #82 | Exceptional 90.8% |
| Immigrants | Moldova | 99.2 /100 | #83 | Exceptional 90.7% |
| Immigrants | Saudi Arabia | 99.1 /100 | #84 | Exceptional 90.7% |
| Romanians | 98.9 /100 | #85 | Exceptional 90.7% |
| Immigrants | Bulgaria | 98.9 /100 | #86 | Exceptional 90.6% |
| Immigrants | Turkey | 98.9 /100 | #87 | Exceptional 90.6% |
| Immigrants | France | 98.8 /100 | #88 | Exceptional 90.6% |
| Canadians | 98.7 /100 | #89 | Exceptional 90.6% |
| Celtics | 98.7 /100 | #90 | Exceptional 90.6% |
| South Africans | 98.6 /100 | #91 | Exceptional 90.6% |