Somali vs Immigrants from the Azores Child Poverty Under the Age of 16
COMPARE
Somali
Immigrants from the Azores
Child Poverty Under the Age of 16
Child Poverty Under the Age of 16 Comparison
Somalis
Immigrants from the Azores
21.0%
CHILD POVERTY UNDER THE AGE OF 16
0.0/ 100
METRIC RATING
304th/ 347
METRIC RANK
17.5%
CHILD POVERTY UNDER THE AGE OF 16
6.2/ 100
METRIC RATING
213th/ 347
METRIC RANK
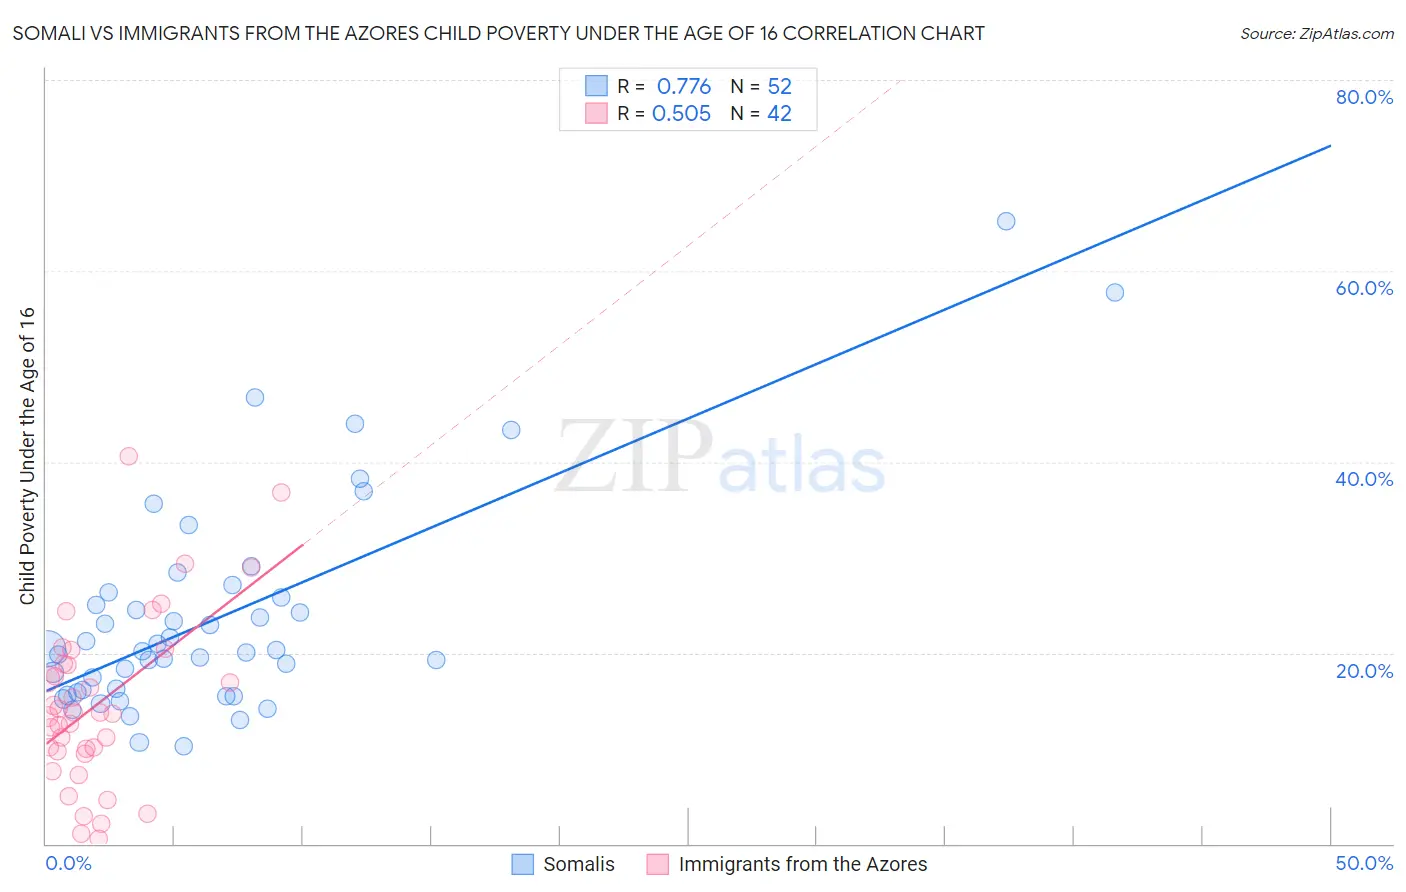
Somali vs Immigrants from the Azores Child Poverty Under the Age of 16 Correlation Chart
The statistical analysis conducted on geographies consisting of 99,170,340 people shows a strong positive correlation between the proportion of Somalis and poverty level among children under the age of 16 in the United States with a correlation coefficient (R) of 0.776 and weighted average of 21.0%. Similarly, the statistical analysis conducted on geographies consisting of 46,043,926 people shows a substantial positive correlation between the proportion of Immigrants from the Azores and poverty level among children under the age of 16 in the United States with a correlation coefficient (R) of 0.505 and weighted average of 17.5%, a difference of 20.0%.
Child Poverty Under the Age of 16 Correlation Summary
| Measurement | Somali | Immigrants from the Azores |
| Minimum | 10.2% | 0.48% |
| Maximum | 65.2% | 40.5% |
| Range | 55.1% | 40.0% |
| Mean | 23.7% | 14.7% |
| Median | 20.2% | 13.7% |
| Interquartile 25% (IQ1) | 16.0% | 9.7% |
| Interquartile 75% (IQ3) | 26.1% | 18.8% |
| Interquartile Range (IQR) | 10.1% | 9.1% |
| Standard Deviation (Sample) | 11.3% | 9.0% |
| Standard Deviation (Population) | 11.2% | 8.9% |
Similar Demographics by Child Poverty Under the Age of 16
Demographics Similar to Somalis by Child Poverty Under the Age of 16
In terms of child poverty under the age of 16, the demographic groups most similar to Somalis are Choctaw (21.0%, a difference of 0.050%), Immigrants from Bahamas (21.0%, a difference of 0.090%), Immigrants from Grenada (21.0%, a difference of 0.33%), Indonesian (21.0%, a difference of 0.37%), and Seminole (21.1%, a difference of 0.47%).
| Demographics | Rating | Rank | Child Poverty Under the Age of 16 |
| Hispanics or Latinos | 0.0 /100 | #297 | Tragic 20.8% |
| Arapaho | 0.0 /100 | #298 | Tragic 20.8% |
| Immigrants | Haiti | 0.0 /100 | #299 | Tragic 20.9% |
| Indonesians | 0.0 /100 | #300 | Tragic 21.0% |
| Immigrants | Grenada | 0.0 /100 | #301 | Tragic 21.0% |
| Immigrants | Bahamas | 0.0 /100 | #302 | Tragic 21.0% |
| Choctaw | 0.0 /100 | #303 | Tragic 21.0% |
| Somalis | 0.0 /100 | #304 | Tragic 21.0% |
| Seminole | 0.0 /100 | #305 | Tragic 21.1% |
| Guatemalans | 0.0 /100 | #306 | Tragic 21.2% |
| Immigrants | Central America | 0.0 /100 | #307 | Tragic 21.3% |
| British West Indians | 0.0 /100 | #308 | Tragic 21.3% |
| Immigrants | Mexico | 0.0 /100 | #309 | Tragic 21.5% |
| Bahamians | 0.0 /100 | #310 | Tragic 21.5% |
| Dutch West Indians | 0.0 /100 | #311 | Tragic 21.5% |
Demographics Similar to Immigrants from the Azores by Child Poverty Under the Age of 16
In terms of child poverty under the age of 16, the demographic groups most similar to Immigrants from the Azores are Iraqi (17.5%, a difference of 0.12%), Malaysian (17.5%, a difference of 0.14%), Immigrants (17.5%, a difference of 0.17%), Immigrants from Thailand (17.5%, a difference of 0.19%), and Sierra Leonean (17.6%, a difference of 0.25%).
| Demographics | Rating | Rank | Child Poverty Under the Age of 16 |
| Alaska Natives | 11.8 /100 | #206 | Poor 17.2% |
| German Russians | 8.6 /100 | #207 | Tragic 17.4% |
| Pennsylvania Germans | 7.5 /100 | #208 | Tragic 17.4% |
| Panamanians | 6.9 /100 | #209 | Tragic 17.5% |
| Alaskan Athabascans | 6.9 /100 | #210 | Tragic 17.5% |
| Immigrants | Thailand | 6.6 /100 | #211 | Tragic 17.5% |
| Immigrants | Immigrants | 6.5 /100 | #212 | Tragic 17.5% |
| Immigrants | Azores | 6.2 /100 | #213 | Tragic 17.5% |
| Iraqis | 5.9 /100 | #214 | Tragic 17.5% |
| Malaysians | 5.9 /100 | #215 | Tragic 17.5% |
| Sierra Leoneans | 5.7 /100 | #216 | Tragic 17.6% |
| Immigrants | Eastern Africa | 5.3 /100 | #217 | Tragic 17.6% |
| Moroccans | 5.3 /100 | #218 | Tragic 17.6% |
| Japanese | 4.7 /100 | #219 | Tragic 17.7% |
| Immigrants | Panama | 4.1 /100 | #220 | Tragic 17.7% |