Somali vs French 4th Grade
COMPARE
Somali
French
4th Grade
4th Grade Comparison
Somalis
French
96.6%
4TH GRADE
0.0/ 100
METRIC RATING
296th/ 347
METRIC RANK
98.3%
4TH GRADE
100.0/ 100
METRIC RATING
28th/ 347
METRIC RANK
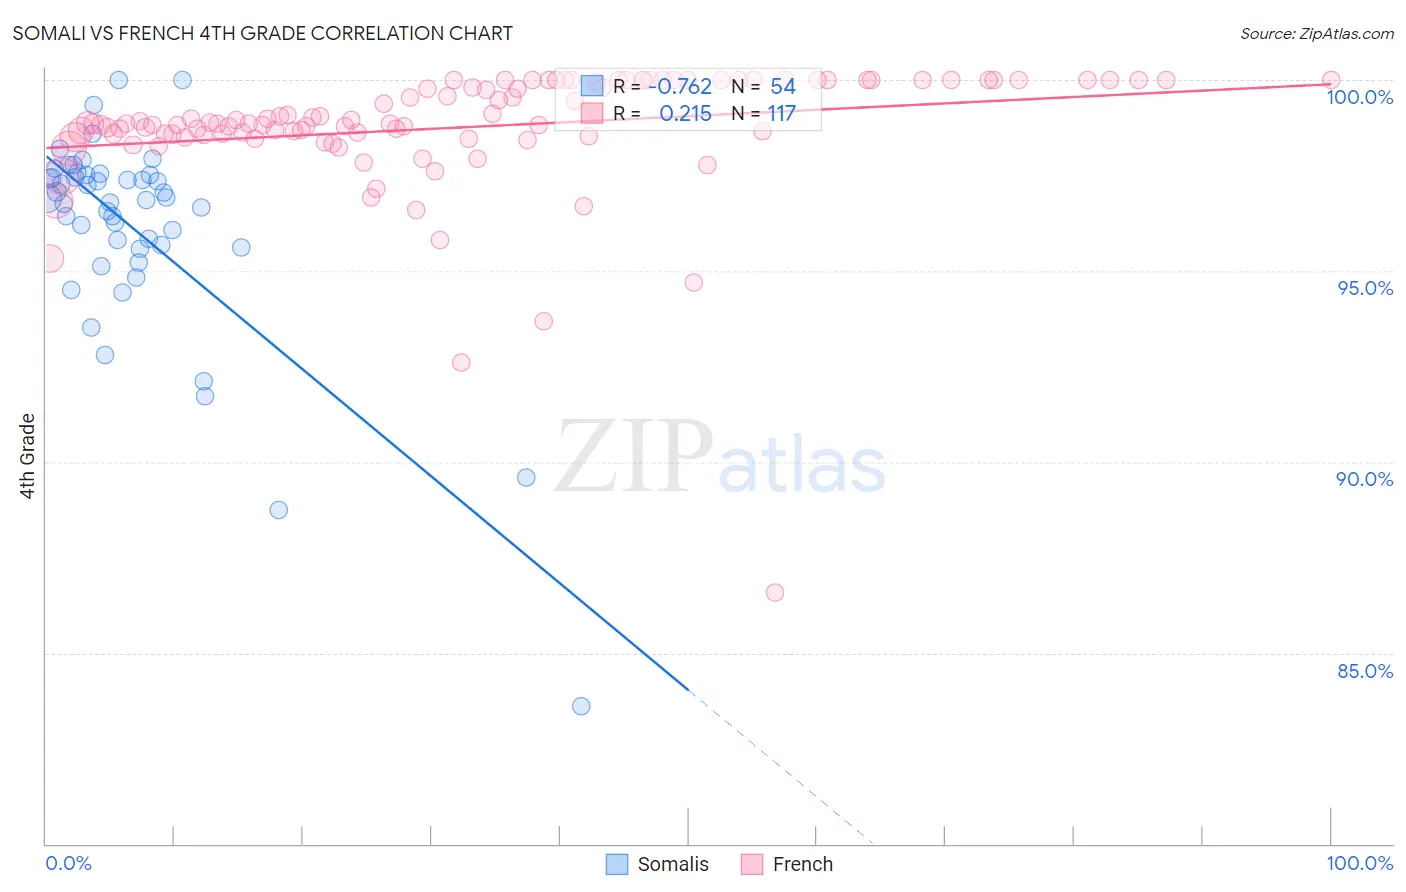
Somali vs French 4th Grade Correlation Chart
The statistical analysis conducted on geographies consisting of 99,332,457 people shows a strong negative correlation between the proportion of Somalis and percentage of population with at least 4th grade education in the United States with a correlation coefficient (R) of -0.762 and weighted average of 96.6%. Similarly, the statistical analysis conducted on geographies consisting of 572,427,269 people shows a weak positive correlation between the proportion of French and percentage of population with at least 4th grade education in the United States with a correlation coefficient (R) of 0.215 and weighted average of 98.3%, a difference of 1.7%.
4th Grade Correlation Summary
| Measurement | Somali | French |
| Minimum | 83.6% | 86.6% |
| Maximum | 100.0% | 100.0% |
| Range | 16.4% | 13.4% |
| Mean | 96.1% | 98.8% |
| Median | 96.9% | 98.9% |
| Interquartile 25% (IQ1) | 95.6% | 98.5% |
| Interquartile 75% (IQ3) | 97.5% | 100.0% |
| Interquartile Range (IQR) | 1.9% | 1.5% |
| Standard Deviation (Sample) | 2.8% | 1.7% |
| Standard Deviation (Population) | 2.8% | 1.7% |
Similar Demographics by 4th Grade
Demographics Similar to Somalis by 4th Grade
In terms of 4th grade, the demographic groups most similar to Somalis are Immigrants from Portugal (96.6%, a difference of 0.010%), Immigrants from Eritrea (96.7%, a difference of 0.030%), Puerto Rican (96.7%, a difference of 0.050%), Malaysian (96.7%, a difference of 0.070%), and Immigrants from Grenada (96.7%, a difference of 0.080%).
| Demographics | Rating | Rank | 4th Grade |
| Immigrants | West Indies | 0.0 /100 | #289 | Tragic 96.7% |
| British West Indians | 0.0 /100 | #290 | Tragic 96.7% |
| Immigrants | Grenada | 0.0 /100 | #291 | Tragic 96.7% |
| Malaysians | 0.0 /100 | #292 | Tragic 96.7% |
| Puerto Ricans | 0.0 /100 | #293 | Tragic 96.7% |
| Immigrants | Eritrea | 0.0 /100 | #294 | Tragic 96.7% |
| Immigrants | Portugal | 0.0 /100 | #295 | Tragic 96.6% |
| Somalis | 0.0 /100 | #296 | Tragic 96.6% |
| Immigrants | Somalia | 0.0 /100 | #297 | Tragic 96.5% |
| Haitians | 0.0 /100 | #298 | Tragic 96.5% |
| Immigrants | Dominica | 0.0 /100 | #299 | Tragic 96.5% |
| Immigrants | South Eastern Asia | 0.0 /100 | #300 | Tragic 96.5% |
| Immigrants | Immigrants | 0.0 /100 | #301 | Tragic 96.5% |
| Immigrants | Cuba | 0.0 /100 | #302 | Tragic 96.4% |
| Guyanese | 0.0 /100 | #303 | Tragic 96.4% |
Demographics Similar to French by 4th Grade
In terms of 4th grade, the demographic groups most similar to French are French Canadian (98.3%, a difference of 0.0%), Croatian (98.3%, a difference of 0.010%), Czech (98.3%, a difference of 0.010%), Danish (98.3%, a difference of 0.020%), and Scotch-Irish (98.3%, a difference of 0.020%).
| Demographics | Rating | Rank | 4th Grade |
| Lithuanians | 100.0 /100 | #21 | Exceptional 98.3% |
| Finns | 100.0 /100 | #22 | Exceptional 98.3% |
| Sioux | 100.0 /100 | #23 | Exceptional 98.3% |
| Danes | 100.0 /100 | #24 | Exceptional 98.3% |
| Scotch-Irish | 100.0 /100 | #25 | Exceptional 98.3% |
| Croatians | 100.0 /100 | #26 | Exceptional 98.3% |
| French Canadians | 100.0 /100 | #27 | Exceptional 98.3% |
| French | 100.0 /100 | #28 | Exceptional 98.3% |
| Czechs | 100.0 /100 | #29 | Exceptional 98.3% |
| Scandinavians | 100.0 /100 | #30 | Exceptional 98.3% |
| Europeans | 100.0 /100 | #31 | Exceptional 98.3% |
| Chinese | 100.0 /100 | #32 | Exceptional 98.3% |
| Swiss | 100.0 /100 | #33 | Exceptional 98.2% |
| Chippewa | 100.0 /100 | #34 | Exceptional 98.2% |
| Italians | 100.0 /100 | #35 | Exceptional 98.2% |