Somali vs Iranian 4th Grade
COMPARE
Somali
Iranian
4th Grade
4th Grade Comparison
Somalis
Iranians
96.6%
4TH GRADE
0.0/ 100
METRIC RATING
296th/ 347
METRIC RANK
98.0%
4TH GRADE
99.4/ 100
METRIC RATING
72nd/ 347
METRIC RANK
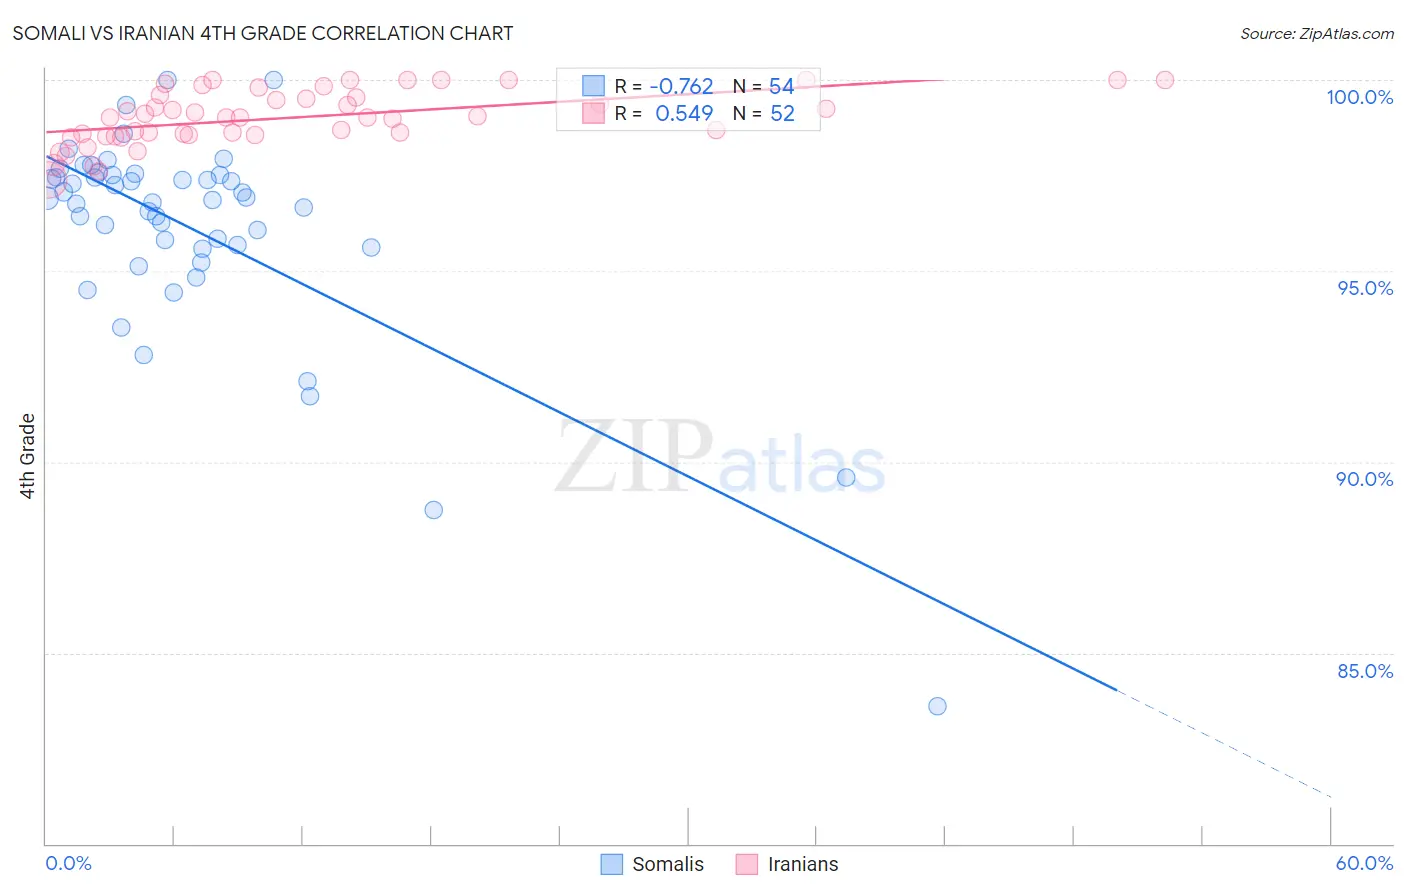
Somali vs Iranian 4th Grade Correlation Chart
The statistical analysis conducted on geographies consisting of 99,332,457 people shows a strong negative correlation between the proportion of Somalis and percentage of population with at least 4th grade education in the United States with a correlation coefficient (R) of -0.762 and weighted average of 96.6%. Similarly, the statistical analysis conducted on geographies consisting of 310,635,884 people shows a substantial positive correlation between the proportion of Iranians and percentage of population with at least 4th grade education in the United States with a correlation coefficient (R) of 0.549 and weighted average of 98.0%, a difference of 1.4%.
4th Grade Correlation Summary
| Measurement | Somali | Iranian |
| Minimum | 83.6% | 97.4% |
| Maximum | 100.0% | 100.0% |
| Range | 16.4% | 2.6% |
| Mean | 96.1% | 99.0% |
| Median | 96.9% | 99.0% |
| Interquartile 25% (IQ1) | 95.6% | 98.6% |
| Interquartile 75% (IQ3) | 97.5% | 99.6% |
| Interquartile Range (IQR) | 1.9% | 1.00% |
| Standard Deviation (Sample) | 2.8% | 0.71% |
| Standard Deviation (Population) | 2.8% | 0.70% |
Similar Demographics by 4th Grade
Demographics Similar to Somalis by 4th Grade
In terms of 4th grade, the demographic groups most similar to Somalis are Immigrants from Portugal (96.6%, a difference of 0.010%), Immigrants from Eritrea (96.7%, a difference of 0.030%), Puerto Rican (96.7%, a difference of 0.050%), Malaysian (96.7%, a difference of 0.070%), and Immigrants from Grenada (96.7%, a difference of 0.080%).
| Demographics | Rating | Rank | 4th Grade |
| Immigrants | West Indies | 0.0 /100 | #289 | Tragic 96.7% |
| British West Indians | 0.0 /100 | #290 | Tragic 96.7% |
| Immigrants | Grenada | 0.0 /100 | #291 | Tragic 96.7% |
| Malaysians | 0.0 /100 | #292 | Tragic 96.7% |
| Puerto Ricans | 0.0 /100 | #293 | Tragic 96.7% |
| Immigrants | Eritrea | 0.0 /100 | #294 | Tragic 96.7% |
| Immigrants | Portugal | 0.0 /100 | #295 | Tragic 96.6% |
| Somalis | 0.0 /100 | #296 | Tragic 96.6% |
| Immigrants | Somalia | 0.0 /100 | #297 | Tragic 96.5% |
| Haitians | 0.0 /100 | #298 | Tragic 96.5% |
| Immigrants | Dominica | 0.0 /100 | #299 | Tragic 96.5% |
| Immigrants | South Eastern Asia | 0.0 /100 | #300 | Tragic 96.5% |
| Immigrants | Immigrants | 0.0 /100 | #301 | Tragic 96.5% |
| Immigrants | Cuba | 0.0 /100 | #302 | Tragic 96.4% |
| Guyanese | 0.0 /100 | #303 | Tragic 96.4% |
Demographics Similar to Iranians by 4th Grade
In terms of 4th grade, the demographic groups most similar to Iranians are Macedonian (98.0%, a difference of 0.0%), Chickasaw (98.0%, a difference of 0.010%), Immigrants from Netherlands (98.0%, a difference of 0.020%), Cherokee (98.0%, a difference of 0.020%), and Immigrants from Lithuania (98.0%, a difference of 0.020%).
| Demographics | Rating | Rank | 4th Grade |
| Immigrants | Northern Europe | 99.6 /100 | #65 | Exceptional 98.0% |
| Canadians | 99.6 /100 | #66 | Exceptional 98.0% |
| New Zealanders | 99.6 /100 | #67 | Exceptional 98.0% |
| Kiowa | 99.6 /100 | #68 | Exceptional 98.0% |
| Pueblo | 99.6 /100 | #69 | Exceptional 98.0% |
| Immigrants | Austria | 99.6 /100 | #70 | Exceptional 98.0% |
| Lumbee | 99.6 /100 | #71 | Exceptional 98.0% |
| Iranians | 99.4 /100 | #72 | Exceptional 98.0% |
| Macedonians | 99.4 /100 | #73 | Exceptional 98.0% |
| Chickasaw | 99.4 /100 | #74 | Exceptional 98.0% |
| Immigrants | Netherlands | 99.3 /100 | #75 | Exceptional 98.0% |
| Cherokee | 99.3 /100 | #76 | Exceptional 98.0% |
| Immigrants | Lithuania | 99.3 /100 | #77 | Exceptional 98.0% |
| Immigrants | England | 99.3 /100 | #78 | Exceptional 98.0% |
| Ukrainians | 99.2 /100 | #79 | Exceptional 98.0% |