Slovene vs Immigrants from Northern Europe Master's Degree
COMPARE
Slovene
Immigrants from Northern Europe
Master's Degree
Master's Degree Comparison
Slovenes
Immigrants from Northern Europe
15.5%
MASTER'S DEGREE
78.0/ 100
METRIC RATING
150th/ 347
METRIC RANK
19.5%
MASTER'S DEGREE
100.0/ 100
METRIC RATING
35th/ 347
METRIC RANK
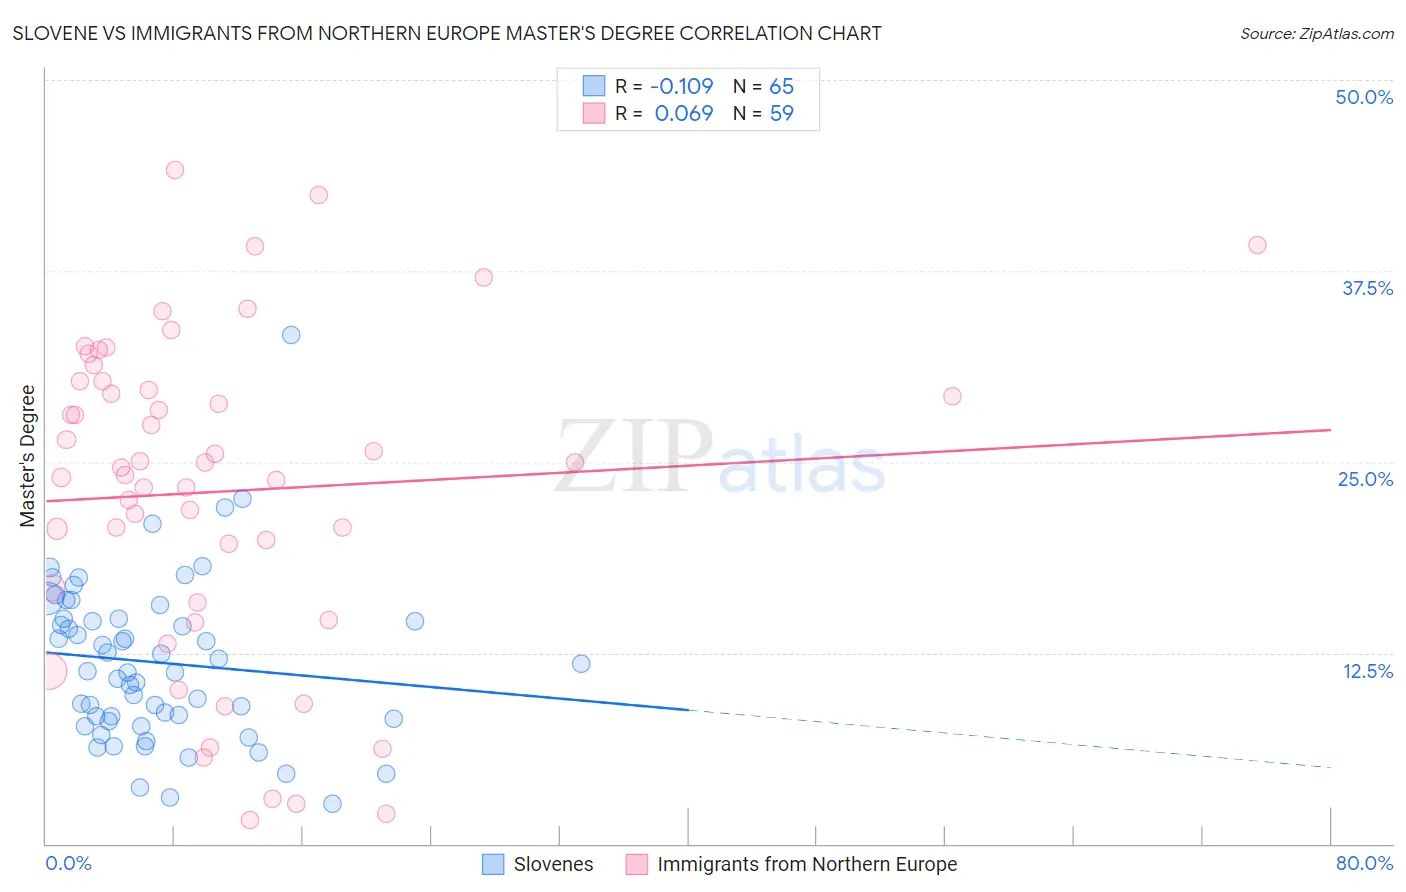
Slovene vs Immigrants from Northern Europe Master's Degree Correlation Chart
The statistical analysis conducted on geographies consisting of 261,310,088 people shows a poor negative correlation between the proportion of Slovenes and percentage of population with at least master's degree education in the United States with a correlation coefficient (R) of -0.109 and weighted average of 15.5%. Similarly, the statistical analysis conducted on geographies consisting of 477,052,190 people shows a slight positive correlation between the proportion of Immigrants from Northern Europe and percentage of population with at least master's degree education in the United States with a correlation coefficient (R) of 0.069 and weighted average of 19.5%, a difference of 25.5%.
Master's Degree Correlation Summary
| Measurement | Slovene | Immigrants from Northern Europe |
| Minimum | 2.6% | 1.5% |
| Maximum | 33.3% | 44.1% |
| Range | 30.7% | 42.6% |
| Mean | 11.9% | 23.1% |
| Median | 11.3% | 24.6% |
| Interquartile 25% (IQ1) | 8.1% | 15.8% |
| Interquartile 75% (IQ3) | 14.8% | 30.2% |
| Interquartile Range (IQR) | 6.7% | 14.4% |
| Standard Deviation (Sample) | 5.4% | 10.5% |
| Standard Deviation (Population) | 5.3% | 10.4% |
Similar Demographics by Master's Degree
Demographics Similar to Slovenes by Master's Degree
In terms of master's degree, the demographic groups most similar to Slovenes are Ghanaian (15.5%, a difference of 0.030%), Immigrants from Senegal (15.5%, a difference of 0.040%), Iraqi (15.5%, a difference of 0.12%), Slavic (15.5%, a difference of 0.17%), and Icelander (15.5%, a difference of 0.20%).
| Demographics | Rating | Rank | Master's Degree |
| Immigrants | Venezuela | 83.6 /100 | #143 | Excellent 15.7% |
| Canadians | 83.3 /100 | #144 | Excellent 15.7% |
| South Americans | 81.3 /100 | #145 | Excellent 15.6% |
| Immigrants | Afghanistan | 79.4 /100 | #146 | Good 15.6% |
| Hungarians | 79.1 /100 | #147 | Good 15.6% |
| Immigrants | Senegal | 78.2 /100 | #148 | Good 15.5% |
| Ghanaians | 78.2 /100 | #149 | Good 15.5% |
| Slovenes | 78.0 /100 | #150 | Good 15.5% |
| Iraqis | 77.3 /100 | #151 | Good 15.5% |
| Slavs | 77.0 /100 | #152 | Good 15.5% |
| Icelanders | 76.8 /100 | #153 | Good 15.5% |
| Immigrants | South America | 76.3 /100 | #154 | Good 15.5% |
| Immigrants | Bangladesh | 76.1 /100 | #155 | Good 15.5% |
| Bermudans | 73.9 /100 | #156 | Good 15.4% |
| Immigrants | Cameroon | 71.7 /100 | #157 | Good 15.4% |
Demographics Similar to Immigrants from Northern Europe by Master's Degree
In terms of master's degree, the demographic groups most similar to Immigrants from Northern Europe are Immigrants from Denmark (19.5%, a difference of 0.33%), Russian (19.5%, a difference of 0.36%), Immigrants from Russia (19.4%, a difference of 0.37%), Mongolian (19.4%, a difference of 0.41%), and Bolivian (19.3%, a difference of 1.1%).
| Demographics | Rating | Rank | Master's Degree |
| Turks | 100.0 /100 | #28 | Exceptional 19.9% |
| Latvians | 100.0 /100 | #29 | Exceptional 19.8% |
| Immigrants | Turkey | 100.0 /100 | #30 | Exceptional 19.7% |
| Immigrants | Korea | 100.0 /100 | #31 | Exceptional 19.7% |
| Burmese | 100.0 /100 | #32 | Exceptional 19.7% |
| Russians | 100.0 /100 | #33 | Exceptional 19.5% |
| Immigrants | Denmark | 100.0 /100 | #34 | Exceptional 19.5% |
| Immigrants | Northern Europe | 100.0 /100 | #35 | Exceptional 19.5% |
| Immigrants | Russia | 100.0 /100 | #36 | Exceptional 19.4% |
| Mongolians | 100.0 /100 | #37 | Exceptional 19.4% |
| Bolivians | 100.0 /100 | #38 | Exceptional 19.3% |
| Immigrants | Spain | 100.0 /100 | #39 | Exceptional 19.1% |
| Immigrants | Bolivia | 100.0 /100 | #40 | Exceptional 19.1% |
| Immigrants | Latvia | 100.0 /100 | #41 | Exceptional 19.1% |
| Immigrants | Saudi Arabia | 100.0 /100 | #42 | Exceptional 19.0% |