Slovene vs Immigrants from Brazil Master's Degree
COMPARE
Slovene
Immigrants from Brazil
Master's Degree
Master's Degree Comparison
Slovenes
Immigrants from Brazil
15.5%
MASTER'S DEGREE
78.0/ 100
METRIC RATING
150th/ 347
METRIC RANK
17.4%
MASTER'S DEGREE
99.4/ 100
METRIC RATING
85th/ 347
METRIC RANK
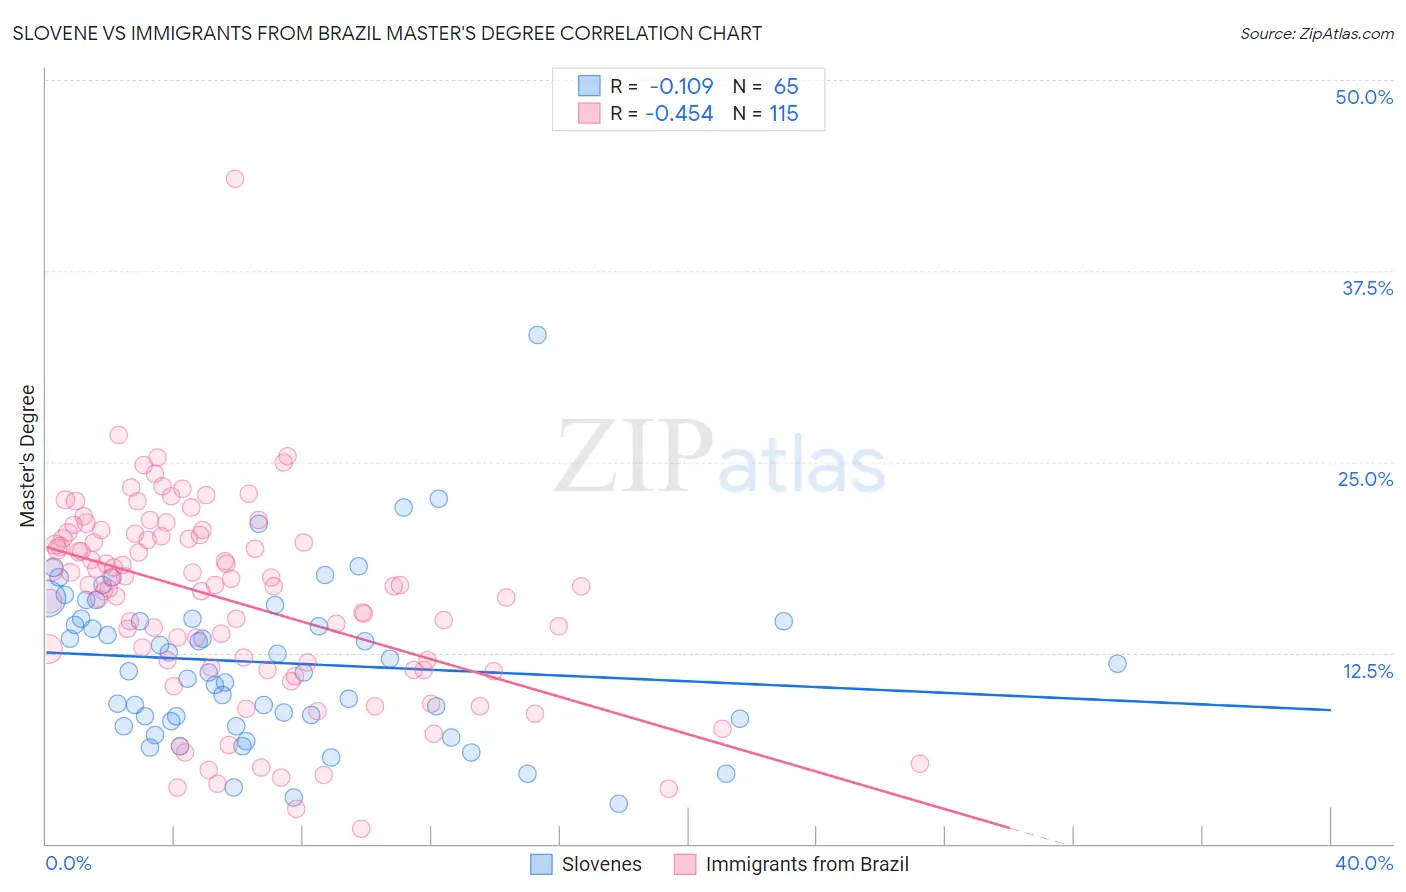
Slovene vs Immigrants from Brazil Master's Degree Correlation Chart
The statistical analysis conducted on geographies consisting of 261,310,088 people shows a poor negative correlation between the proportion of Slovenes and percentage of population with at least master's degree education in the United States with a correlation coefficient (R) of -0.109 and weighted average of 15.5%. Similarly, the statistical analysis conducted on geographies consisting of 342,959,750 people shows a moderate negative correlation between the proportion of Immigrants from Brazil and percentage of population with at least master's degree education in the United States with a correlation coefficient (R) of -0.454 and weighted average of 17.4%, a difference of 11.8%.
Master's Degree Correlation Summary
| Measurement | Slovene | Immigrants from Brazil |
| Minimum | 2.6% | 0.97% |
| Maximum | 33.3% | 43.5% |
| Range | 30.7% | 42.6% |
| Mean | 11.9% | 15.9% |
| Median | 11.3% | 16.9% |
| Interquartile 25% (IQ1) | 8.1% | 11.5% |
| Interquartile 75% (IQ3) | 14.8% | 20.2% |
| Interquartile Range (IQR) | 6.7% | 8.7% |
| Standard Deviation (Sample) | 5.4% | 6.5% |
| Standard Deviation (Population) | 5.3% | 6.4% |
Similar Demographics by Master's Degree
Demographics Similar to Slovenes by Master's Degree
In terms of master's degree, the demographic groups most similar to Slovenes are Ghanaian (15.5%, a difference of 0.030%), Immigrants from Senegal (15.5%, a difference of 0.040%), Iraqi (15.5%, a difference of 0.12%), Slavic (15.5%, a difference of 0.17%), and Icelander (15.5%, a difference of 0.20%).
| Demographics | Rating | Rank | Master's Degree |
| Immigrants | Venezuela | 83.6 /100 | #143 | Excellent 15.7% |
| Canadians | 83.3 /100 | #144 | Excellent 15.7% |
| South Americans | 81.3 /100 | #145 | Excellent 15.6% |
| Immigrants | Afghanistan | 79.4 /100 | #146 | Good 15.6% |
| Hungarians | 79.1 /100 | #147 | Good 15.6% |
| Immigrants | Senegal | 78.2 /100 | #148 | Good 15.5% |
| Ghanaians | 78.2 /100 | #149 | Good 15.5% |
| Slovenes | 78.0 /100 | #150 | Good 15.5% |
| Iraqis | 77.3 /100 | #151 | Good 15.5% |
| Slavs | 77.0 /100 | #152 | Good 15.5% |
| Icelanders | 76.8 /100 | #153 | Good 15.5% |
| Immigrants | South America | 76.3 /100 | #154 | Good 15.5% |
| Immigrants | Bangladesh | 76.1 /100 | #155 | Good 15.5% |
| Bermudans | 73.9 /100 | #156 | Good 15.4% |
| Immigrants | Cameroon | 71.7 /100 | #157 | Good 15.4% |
Demographics Similar to Immigrants from Brazil by Master's Degree
In terms of master's degree, the demographic groups most similar to Immigrants from Brazil are Immigrants from Scotland (17.4%, a difference of 0.18%), Immigrants from Croatia (17.3%, a difference of 0.41%), Immigrants from Zimbabwe (17.4%, a difference of 0.51%), Maltese (17.3%, a difference of 0.51%), and Greek (17.5%, a difference of 0.57%).
| Demographics | Rating | Rank | Master's Degree |
| Immigrants | Hungary | 99.6 /100 | #78 | Exceptional 17.5% |
| Immigrants | Lebanon | 99.6 /100 | #79 | Exceptional 17.5% |
| Carpatho Rusyns | 99.6 /100 | #80 | Exceptional 17.5% |
| Immigrants | Western Asia | 99.5 /100 | #81 | Exceptional 17.5% |
| Greeks | 99.5 /100 | #82 | Exceptional 17.5% |
| Immigrants | Zimbabwe | 99.5 /100 | #83 | Exceptional 17.4% |
| Immigrants | Scotland | 99.4 /100 | #84 | Exceptional 17.4% |
| Immigrants | Brazil | 99.4 /100 | #85 | Exceptional 17.4% |
| Immigrants | Croatia | 99.3 /100 | #86 | Exceptional 17.3% |
| Maltese | 99.3 /100 | #87 | Exceptional 17.3% |
| Immigrants | Canada | 99.2 /100 | #88 | Exceptional 17.2% |
| Bhutanese | 99.1 /100 | #89 | Exceptional 17.2% |
| Immigrants | Egypt | 99.1 /100 | #90 | Exceptional 17.2% |
| Romanians | 99.1 /100 | #91 | Exceptional 17.2% |
| Immigrants | North America | 99.1 /100 | #92 | Exceptional 17.2% |