Slovene vs Immigrants from North America Doctorate Degree

COMPARE

Slovene
Race
Ancestry
AfghanAfricanAlaska NativeAlaskan AthabascanAlbanianAleutAlsatianAmericanApacheArabArapahoArgentineanArmenianAssyrian/Chaldean/SyriacAustralianAustrianBahamianBangladeshiBarbadianBasqueBelgianBelizeanBermudanBhutaneseBlackfeetBolivianBrazilianBritishBritish West IndianBulgarianBurmeseCajunCambodianCanadianCape VerdeanCarpatho RusynCelticCentral AmericanCentral American IndianCherokeeCheyenneChickasawChileanChineseChippewaChoctawColombianColvilleComancheCosta RicanCreeCreekCroatianCrowCubanCypriotCzechCzechoslovakianDanishDelawareDominicanDutchDutch West IndianEastern EuropeanEcuadorianEgyptianEnglishEstonianEthiopianEuropeanFijianFilipinoFinnishFrenchFrench American IndianFrench CanadianGermanGerman RussianGhanaianGreekGuamanian/ChamorroGuatemalanGuyaneseHaitianHmongHonduranHopiHoumaHungarianIcelanderIndian (Asian)IndonesianInupiatIranianIraqiIrishIroquoisIsraeliItalianJamaicanJapaneseJordanianKenyanKiowaKoreanLaotianLatvianLebaneseLiberianLithuanianLumbeeLuxembourgerMacedonianMalaysianMalteseMarshalleseMenomineeMexicanMexican American IndianMongolianMoroccanNative HawaiianNavajoNepaleseNew ZealanderNicaraguanNigerianNorthern EuropeanNorwegianOkinawanOsageOttawaPaiutePakistaniPalestinianPanamanianParaguayanPennsylvania GermanPeruvianPimaPolishPortuguesePotawatomiPuebloPuerto RicanPuget Sound SalishRomanianRussianSalvadoranSamoanScandinavianScotch-IrishScottishSeminoleSenegaleseSerbianShoshoneSierra LeoneanSiouxSlavicSlovakSloveneSomaliSouth AfricanSouth AmericanSouth American IndianSoviet UnionSpaniardSpanishSpanish AmericanSpanish American IndianSri LankanSubsaharan AfricanSudaneseSwedishSwissSyrianTaiwaneseThaiTlingit-HaidaTohono O'OdhamTonganTrinidadian and TobagonianTsimshianTurkishU.S. Virgin IslanderUgandanUkrainianUruguayanUteVenezuelanVietnameseWelshWest IndianYakamaYaquiYugoslavianYumanYup'ikZimbabwean
Immigration
NonimmigrantsImmigrantsAfghanistanAfricaAlbaniaArgentinaArmeniaAsiaAustraliaAustriaBahamasBangladeshBarbadosBelarusBelgiumBelizeBoliviaBosnia and HerzegovinaBrazilBulgariaBurma/MyanmarCabo VerdeCambodiaCameroonCanadaCaribbeanCentral AmericaChileChinaColombiaCongoCosta RicaCroatiaCubaCzechoslovakiaDenmarkDominicaDominican RepublicEastern AfricaEastern AsiaEastern EuropeEcuadorEgyptEl SalvadorEnglandEritreaEthiopiaEuropeFijiFranceGermanyGhanaGreeceGrenadaGuatemalaGuyanaHaitiHondurasHong KongHungaryIndiaIndonesiaIranIraqIrelandIsraelItalyJamaicaJapanJordanKazakhstanKenyaKoreaKuwaitLaosLatin AmericaLatviaLebanonLiberiaLithuaniaMalaysiaMexicoMicronesiaMiddle AfricaMoldovaMoroccoNepalNetherlandsNicaraguaNigeriaNorth MacedoniaNorthern AfricaNorthern EuropeNorwayOceaniaPakistanPanamaPeruPhilippinesPolandPortugalRomaniaRussiaSaudi ArabiaScotlandSenegalSerbiaSierra LeoneSingaporeSomaliaSouth AfricaSouth AmericaSouth Central AsiaSouth Eastern AsiaSouthern EuropeSpainSri LankaSt. Vincent and the GrenadinesSudanSwedenSwitzerlandSyriaTaiwanThailandTrinidad and TobagoTurkeyUgandaUkraineUruguayUzbekistanVenezuelaVietnamWest IndiesWestern AfricaWestern AsiaWestern EuropeYemenZaireZimbabweAzores
Immigrants from North America
Race
Ancestry
AfghanAfricanAlaska NativeAlaskan AthabascanAlbanianAleutAlsatianAmericanApacheArabArapahoArgentineanArmenianAssyrian/Chaldean/SyriacAustralianAustrianBahamianBangladeshiBarbadianBasqueBelgianBelizeanBermudanBhutaneseBlackfeetBolivianBrazilianBritishBritish West IndianBulgarianBurmeseCajunCambodianCanadianCape VerdeanCarpatho RusynCelticCentral AmericanCentral American IndianCherokeeCheyenneChickasawChileanChineseChippewaChoctawColombianColvilleComancheCosta RicanCreeCreekCroatianCrowCubanCypriotCzechCzechoslovakianDanishDelawareDominicanDutchDutch West IndianEastern EuropeanEcuadorianEgyptianEnglishEstonianEthiopianEuropeanFijianFilipinoFinnishFrenchFrench American IndianFrench CanadianGermanGerman RussianGhanaianGreekGuamanian/ChamorroGuatemalanGuyaneseHaitianHmongHonduranHopiHoumaHungarianIcelanderIndian (Asian)IndonesianInupiatIranianIraqiIrishIroquoisIsraeliItalianJamaicanJapaneseJordanianKenyanKiowaKoreanLaotianLatvianLebaneseLiberianLithuanianLumbeeLuxembourgerMacedonianMalaysianMalteseMarshalleseMenomineeMexicanMexican American IndianMongolianMoroccanNative HawaiianNavajoNepaleseNew ZealanderNicaraguanNigerianNorthern EuropeanNorwegianOkinawanOsageOttawaPaiutePakistaniPalestinianPanamanianParaguayanPennsylvania GermanPeruvianPimaPolishPortuguesePotawatomiPuebloPuerto RicanPuget Sound SalishRomanianRussianSalvadoranSamoanScandinavianScotch-IrishScottishSeminoleSenegaleseSerbianShoshoneSierra LeoneanSiouxSlavicSlovakSomaliSouth AfricanSouth AmericanSouth American IndianSoviet UnionSpaniardSpanishSpanish AmericanSpanish American IndianSri LankanSubsaharan AfricanSudaneseSwedishSwissSyrianTaiwaneseThaiTlingit-HaidaTohono O'OdhamTonganTrinidadian and TobagonianTsimshianTurkishU.S. Virgin IslanderUgandanUkrainianUruguayanUteVenezuelanVietnameseWelshWest IndianYakamaYaquiYugoslavianYumanYup'ikZimbabwean
Immigration
NonimmigrantsImmigrantsAfghanistanAfricaAlbaniaArgentinaArmeniaAsiaAustraliaAustriaBahamasBangladeshBarbadosBelarusBelgiumBelizeBoliviaBosnia and HerzegovinaBrazilBulgariaBurma/MyanmarCabo VerdeCambodiaCameroonCanadaCaribbeanCentral AmericaChileChinaColombiaCongoCosta RicaCroatiaCubaCzechoslovakiaDenmarkDominicaDominican RepublicEastern AfricaEastern AsiaEastern EuropeEcuadorEgyptEl SalvadorEnglandEritreaEthiopiaEuropeFijiFranceGermanyGhanaGreeceGrenadaGuatemalaGuyanaHaitiHondurasHong KongHungaryIndiaIndonesiaIranIraqIrelandIsraelItalyJamaicaJapanJordanKazakhstanKenyaKoreaKuwaitLaosLatin AmericaLatviaLebanonLiberiaLithuaniaMalaysiaMexicoMicronesiaMiddle AfricaMoldovaMoroccoNepalNetherlandsNicaraguaNigeriaNorth AmericaNorth MacedoniaNorthern AfricaNorthern EuropeNorwayOceaniaPakistanPanamaPeruPhilippinesPolandPortugalRomaniaRussiaSaudi ArabiaScotlandSenegalSerbiaSierra LeoneSingaporeSomaliaSouth AfricaSouth AmericaSouth Central AsiaSouth Eastern AsiaSouthern EuropeSpainSri LankaSt. Vincent and the GrenadinesSudanSwedenSwitzerlandSyriaTaiwanThailandTrinidad and TobagoTurkeyUgandaUkraineUruguayUzbekistanVenezuelaVietnamWest IndiesWestern AfricaWestern AsiaWestern EuropeYemenZaireZimbabweAzores
Doctorate Degree
Income
Poverty
Unemployment
Labor Participation
Family Structure
Vehicle Availability
Education Level
Disability

Doctorate Degree Comparison

Slovenes

Immigrants from North America

Good
Exceptional
1.9%
DOCTORATE DEGREE
70.2/ 100
METRIC RATING
159th/ 347
METRIC RANK
2.2%
DOCTORATE DEGREE
99.8/ 100
METRIC RATING
74th/ 347
METRIC RANK

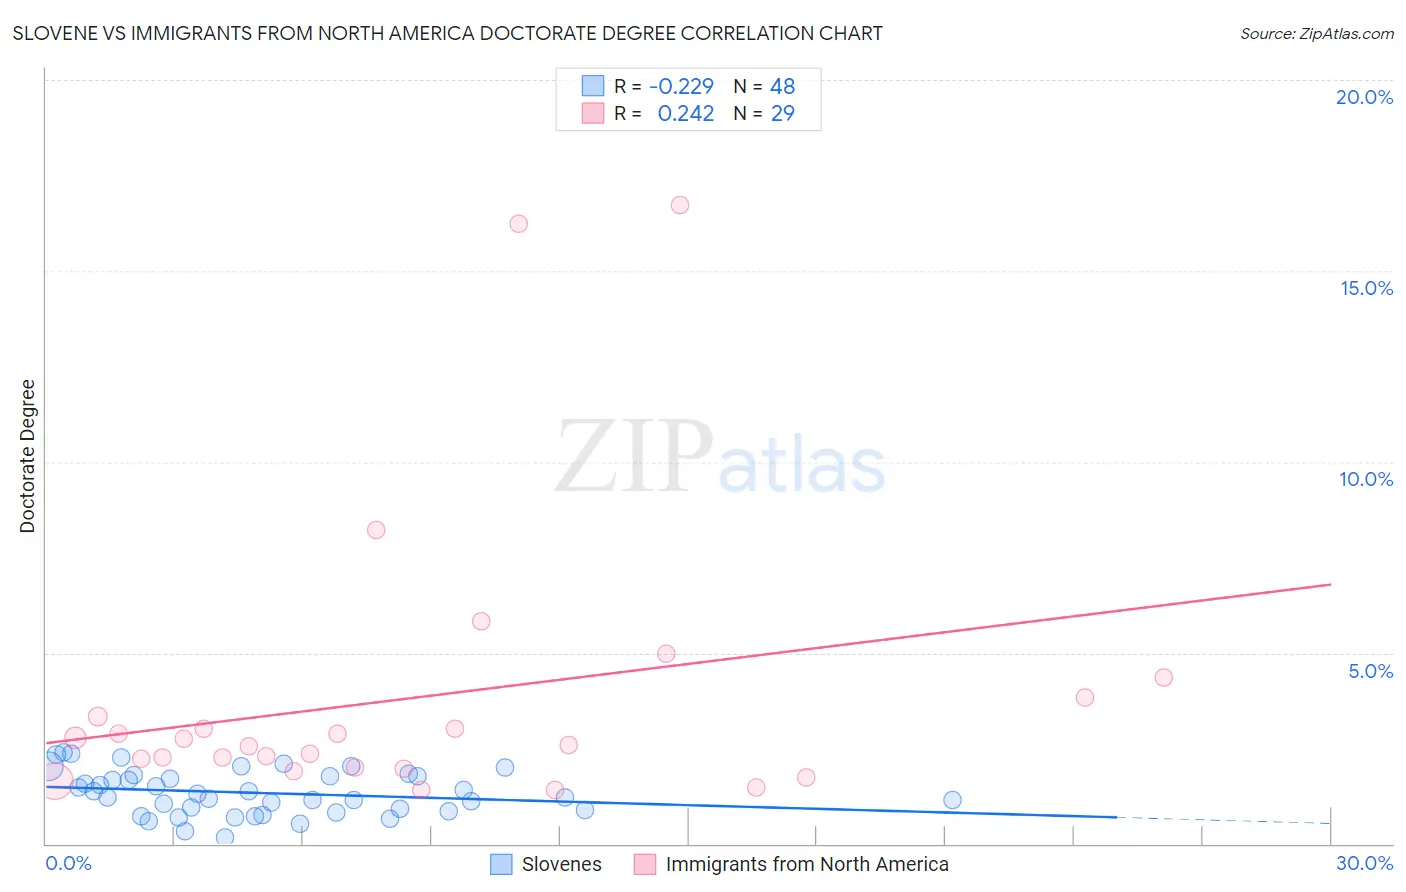
Slovene vs Immigrants from North America Doctorate Degree Correlation Chart

The statistical analysis conducted on geographies consisting of 259,569,588 people shows a weak negative correlation between the proportion of Slovenes and percentage of population with at least doctorate degree education in the United States with a correlation coefficient (R) of -0.229 and weighted average of 1.9%. Similarly, the statistical analysis conducted on geographies consisting of 455,963,047 people shows a weak positive correlation between the proportion of Immigrants from North America and percentage of population with at least doctorate degree education in the United States with a correlation coefficient (R) of 0.242 and weighted average of 2.2%, a difference of 18.6%.
Slovene vs Immigrants from North America Doctorate Degree

Doctorate Degree Correlation Summary

MeasurementSloveneImmigrants from North America
Minimum0.15%1.4%
Maximum2.4%16.7%
Range2.2%15.3%
Mean1.3%3.8%
Median1.3%2.6%
Interquartile 25% (IQ1)0.87%2.0%
Interquartile 75% (IQ3)1.8%3.6%
Interquartile Range (IQR)0.89%1.6%
Standard Deviation (Sample)0.57%3.8%
Standard Deviation (Population)0.56%3.7%

Similar Demographics by Doctorate Degree

Demographics Similar to Slovenes by Doctorate Degree

In terms of doctorate degree, the demographic groups most similar to Slovenes are Welsh (1.9%, a difference of 0.090%), Immigrants from Middle Africa (1.9%, a difference of 0.24%), Hungarian (1.9%, a difference of 0.26%), Danish (1.9%, a difference of 0.29%), and Slavic (1.9%, a difference of 0.37%).
DemographicsRating | RankDoctorate Degree
Immigrants | Kenya
74.3
/100
|
#152
Good
1.9%
Immigrants | Oceania
74.0
/100
|
#153
Good
1.9%
Immigrants | Albania
72.8
/100
|
#154
Good
1.9%
Poles
72.7
/100
|
#155
Good
1.9%
Slavs
72.4
/100
|
#156
Good
1.9%
Danes
71.9
/100
|
#157
Good
1.9%
Hungarians
71.7
/100
|
#158
Good
1.9%
Slovenes
70.2
/100
|
#159
Good
1.9%
Welsh
69.7
/100
|
#160
Good
1.9%
Immigrants | Middle Africa
68.8
/100
|
#161
Good
1.9%
Irish
67.5
/100
|
#162
Good
1.9%
Czechs
67.3
/100
|
#163
Good
1.9%
Celtics
66.7
/100
|
#164
Good
1.9%
Scotch-Irish
63.6
/100
|
#165
Good
1.9%
Spaniards
63.5
/100
|
#166
Good
1.9%

Demographics Similar to Immigrants from North America by Doctorate Degree

In terms of doctorate degree, the demographic groups most similar to Immigrants from North America are Immigrants from Western Asia (2.2%, a difference of 0.10%), Immigrants from Bulgaria (2.3%, a difference of 0.14%), Immigrants from Hungary (2.2%, a difference of 0.18%), Immigrants from Lebanon (2.2%, a difference of 0.18%), and Immigrants from Canada (2.3%, a difference of 0.22%).
DemographicsRating | RankDoctorate Degree
Zimbabweans
99.8
/100
|
#67
Exceptional
2.3%
Immigrants | Kazakhstan
99.8
/100
|
#68
Exceptional
2.3%
Carpatho Rusyns
99.8
/100
|
#69
Exceptional
2.3%
Lithuanians
99.8
/100
|
#70
Exceptional
2.3%
Immigrants | Bolivia
99.8
/100
|
#71
Exceptional
2.3%
Immigrants | Canada
99.8
/100
|
#72
Exceptional
2.3%
Immigrants | Bulgaria
99.8
/100
|
#73
Exceptional
2.3%
Immigrants | North America
99.8
/100
|
#74
Exceptional
2.2%
Immigrants | Western Asia
99.8
/100
|
#75
Exceptional
2.2%
Immigrants | Hungary
99.8
/100
|
#76
Exceptional
2.2%
Immigrants | Lebanon
99.8
/100
|
#77
Exceptional
2.2%
Immigrants | Belarus
99.7
/100
|
#78
Exceptional
2.2%
Northern Europeans
99.7
/100
|
#79
Exceptional
2.2%
Ugandans
99.7
/100
|
#80
Exceptional
2.2%
Immigrants | Argentina
99.7
/100
|
#81
Exceptional
2.2%